

There’s been a huge backlash against immigration in the West recently. In the UK, anti-immigration protests have taken place:

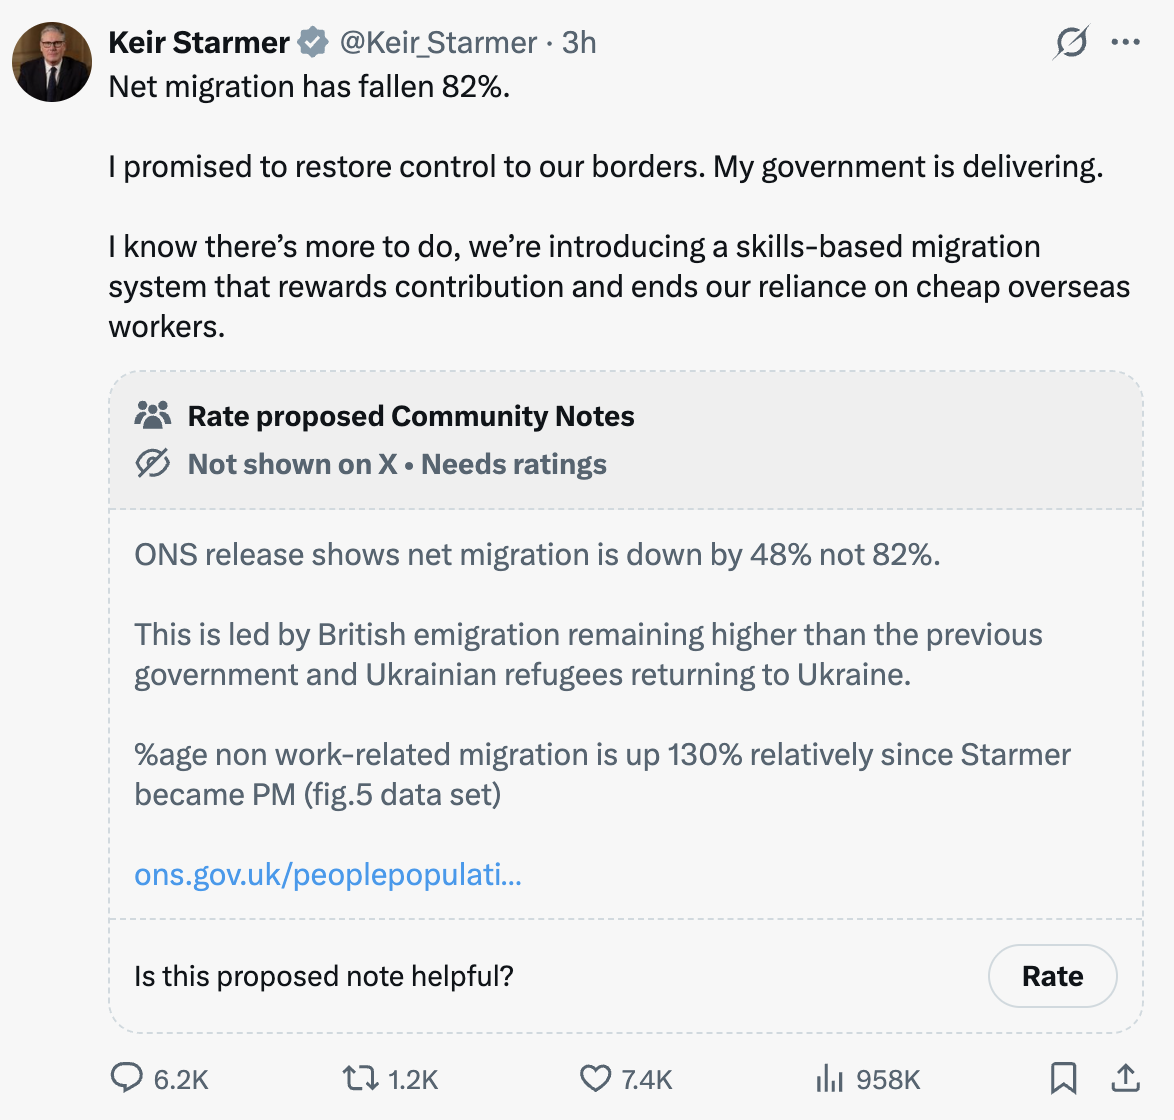
The UK Prime Minister is actively trying to display an image of toughness against immigration—and failing:
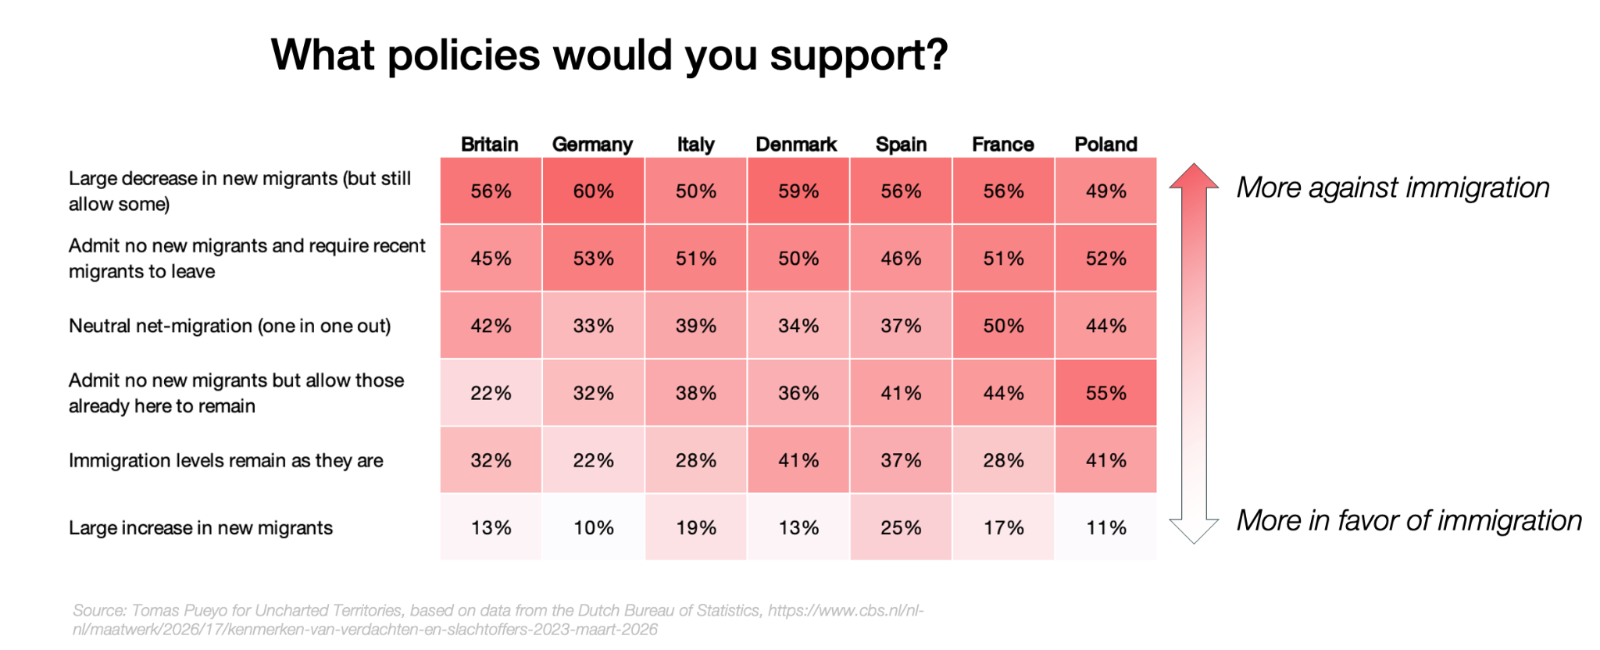
Across Europe, people support policies to stop and revert immigration.
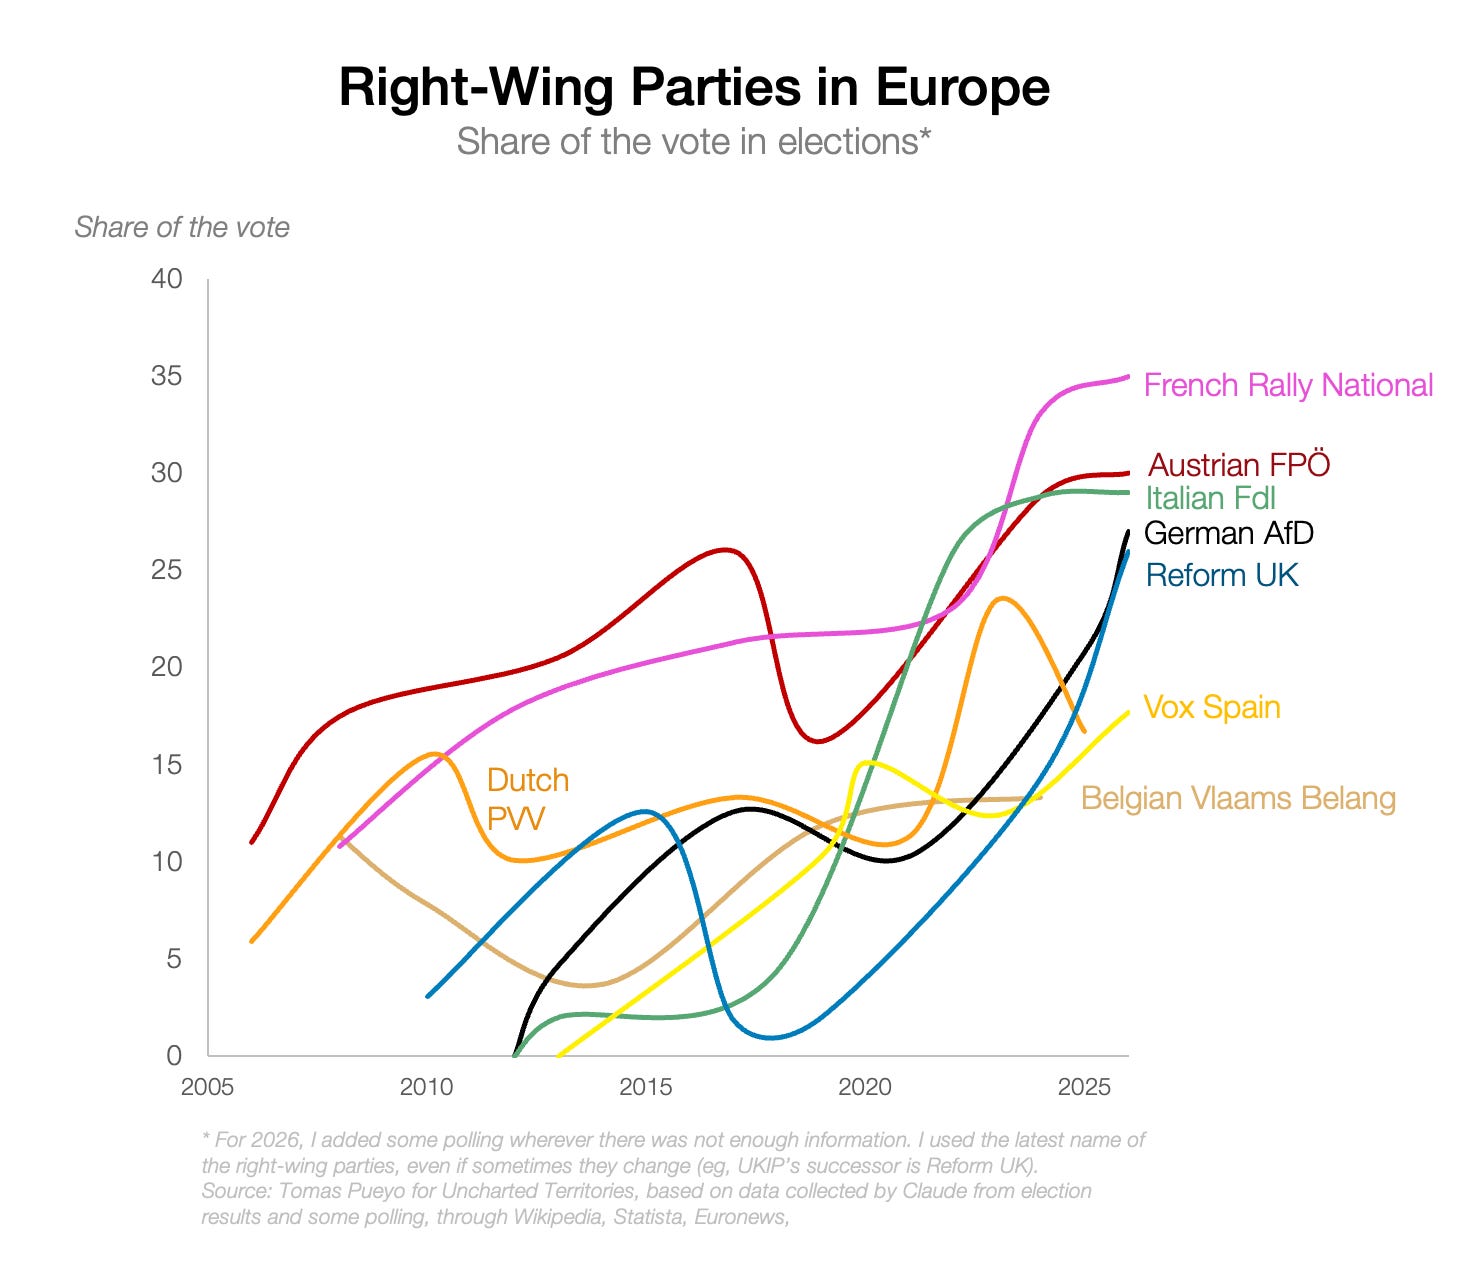
The Danish socialist prime minister implemented a zero asylum policy and is toughening deportation laws. A Dutch party in the ruling coalition is pushing for sweeping anti-immigrant rules. But most governments are not acting as fast as public opinion is asking, so right-wing parties around Europe are gaining traction and are becoming front-runners
But the EU has had plenty of immigration for decades, since Schengen opened border movement, and despite some initial fear, it turned out quite well. What happened? A lot of the immigration came from within the EU, but now the vast majority is from outside. Of them, the biggest group is Muslims, at 40%.1 This is causing friction:
Austria has banned headscarves for girls below 14.
German Chancellor Merz vowed to expel 80% of the 1M Syrians currently living in Germany within three years.
Even in the US, which doesn’t receive a particularly high amount of Muslim immigrants, President Trump called Somalian immigrants garbage and signed an expanded travel ban, applicable to many from the Middle East and Africa.
When you read the media, social media, and talk on the street, the main complaints you hear are the social and economic costs: Immigrants cause more crime and more terrorism, they destroy social cohesion, work less, and consume much more welfare. Are these claims true? For which immigrants?
1. The Social Costs
As we discussed in the previous article, the social costs of immigration can be crime, terrorism, native flight, and the loss of social cohesion, so let’s look at each.
Crime
The most typical complaint I see people make is this:
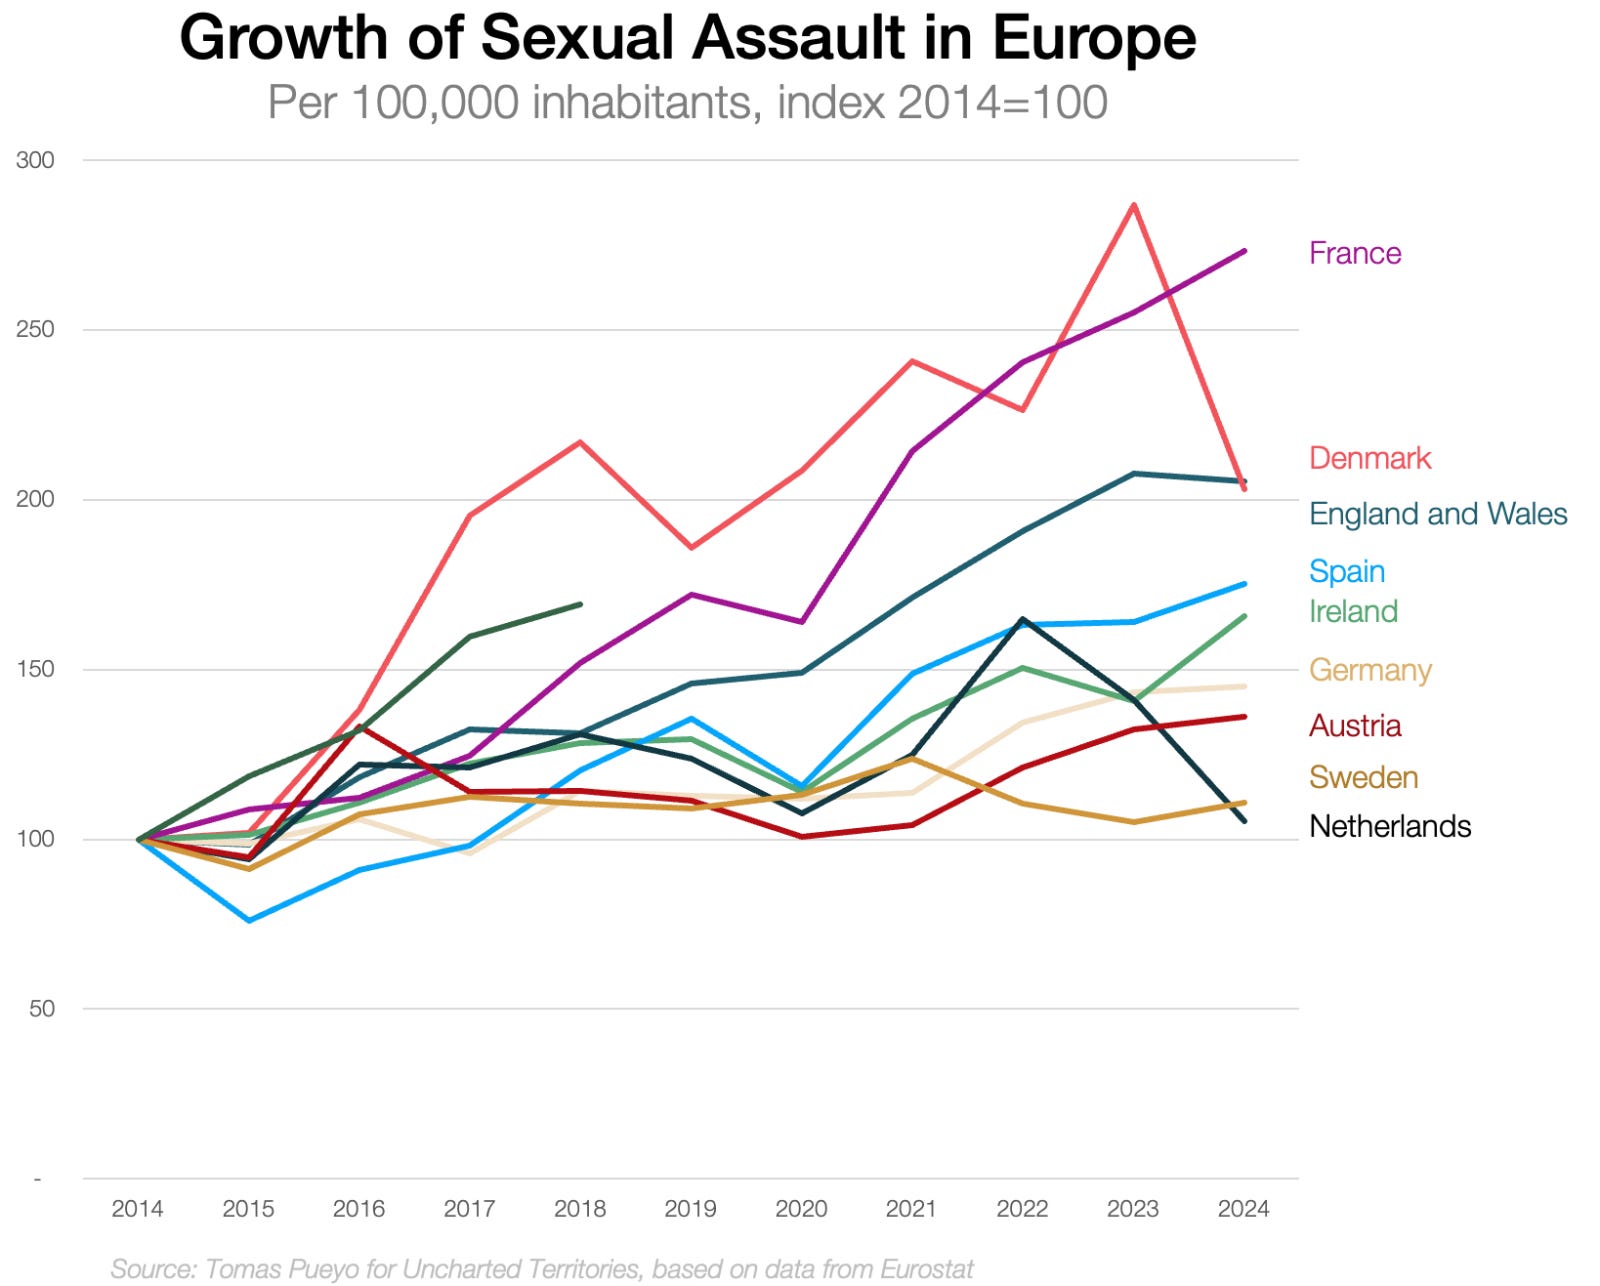
Indeed, while the EU population increased by less than 2% between 2014 and 2024, sexual assaults increased by 72%, rapes by 150%, sexual exploitation by 89%, attempted intentional homicides by 47%, and serious assaults by 45%. Violent crime has decreased, though: robberies by 33%, burglaries 15%, and theft by 22%.
So what’s going on?
This chart combines data for five European countries: Austria, Denmark, Finland, Germany, and Italy.
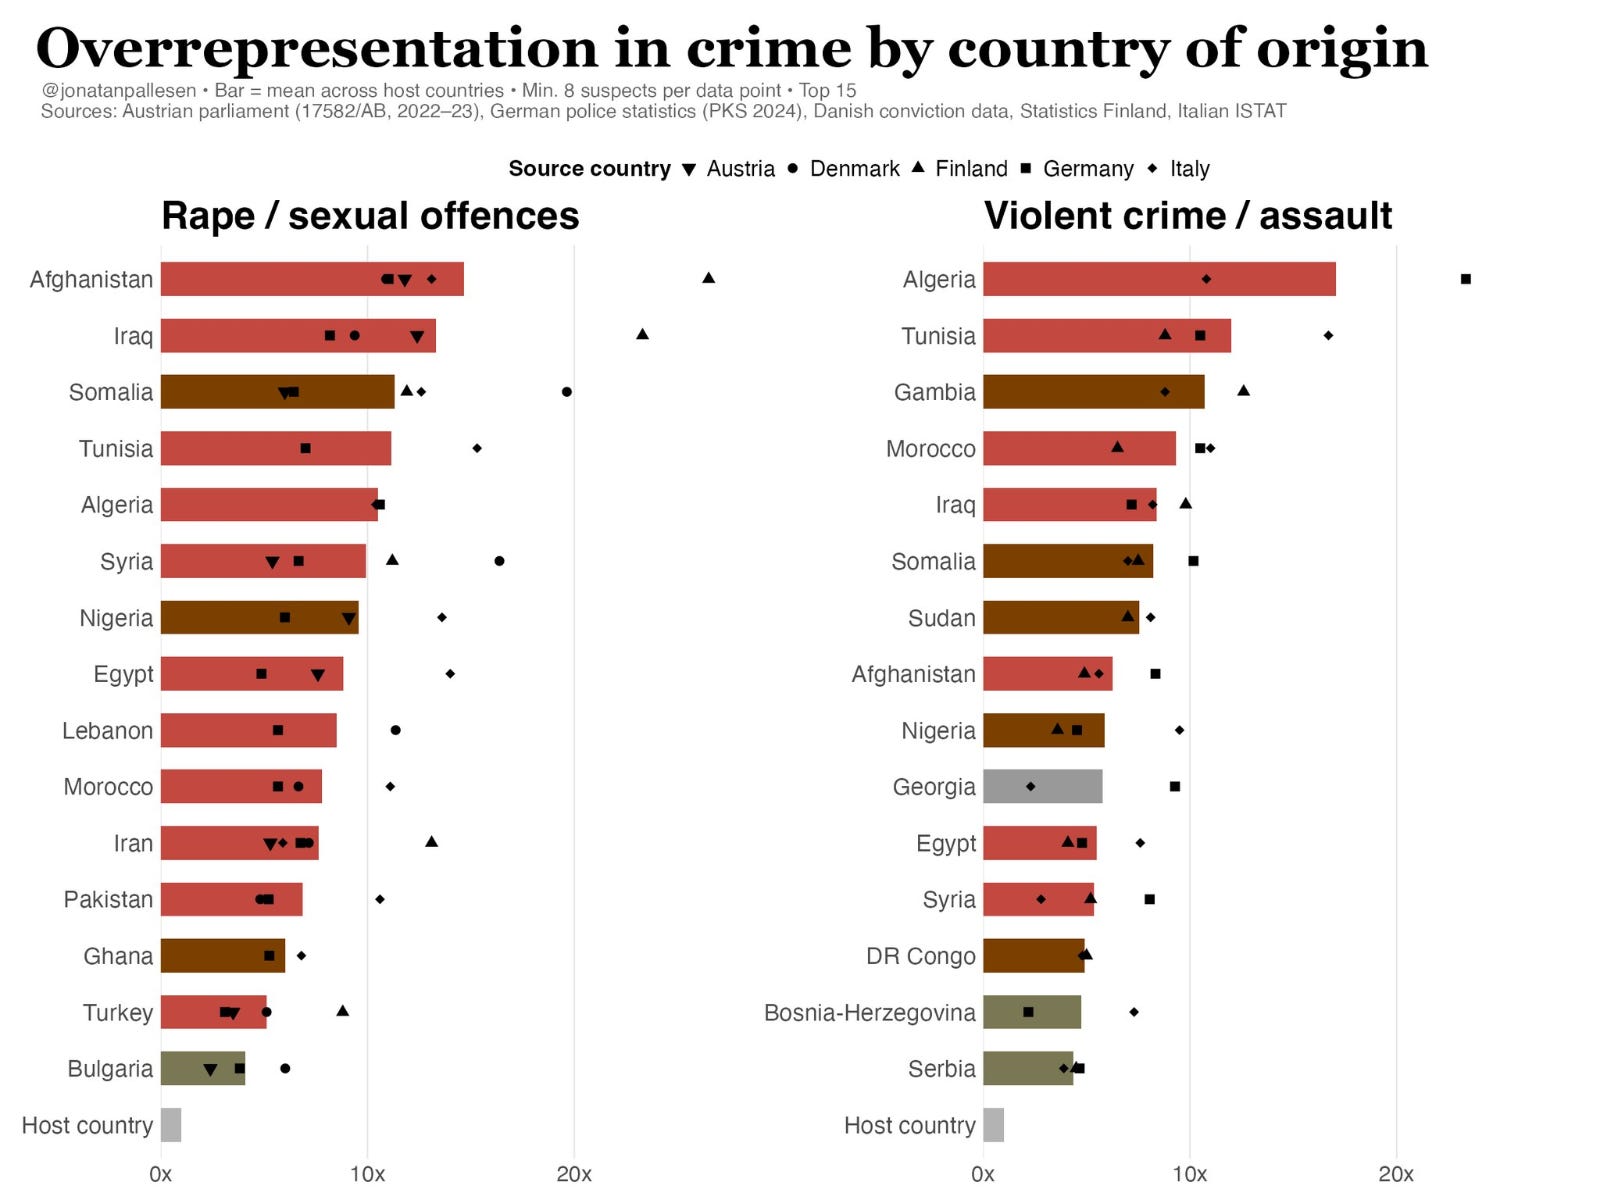
Clearly, immigrants from Muslim countries are overrepresented across most of these host countries. Let’s look at each one in turn.
Germany
These crime statistics were just released for Germany in 2025. This is how much more likely foreigners are to commit crime vs locals:
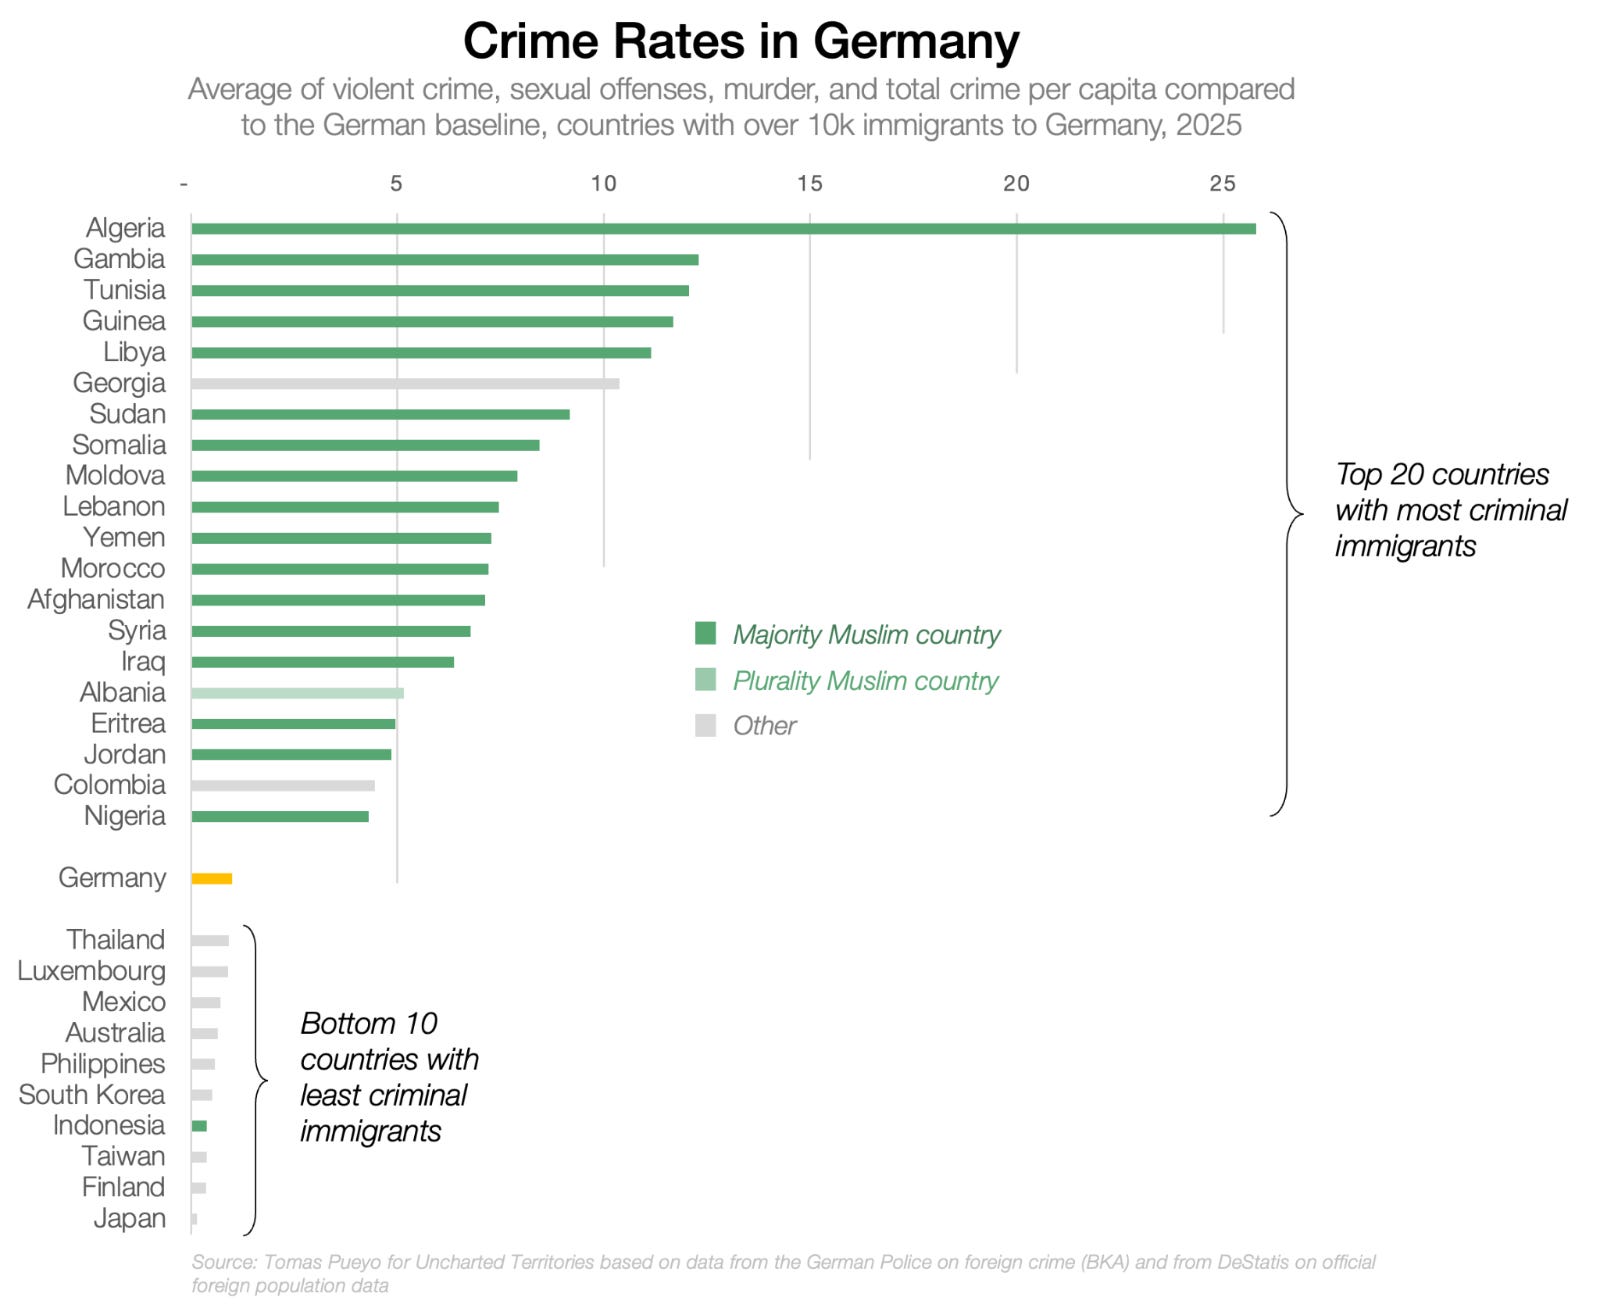
Algerians in Germany are 26x more prone to crime than the average German. 13 other Muslim-majority nationalities are at least 5x more criminal than the average German. Only one non-Muslim majority meets that requirement (Georgia).
If you break the numbers down by pickpocketing, sex crimes, murder, and overall crime rate, this is what you get:
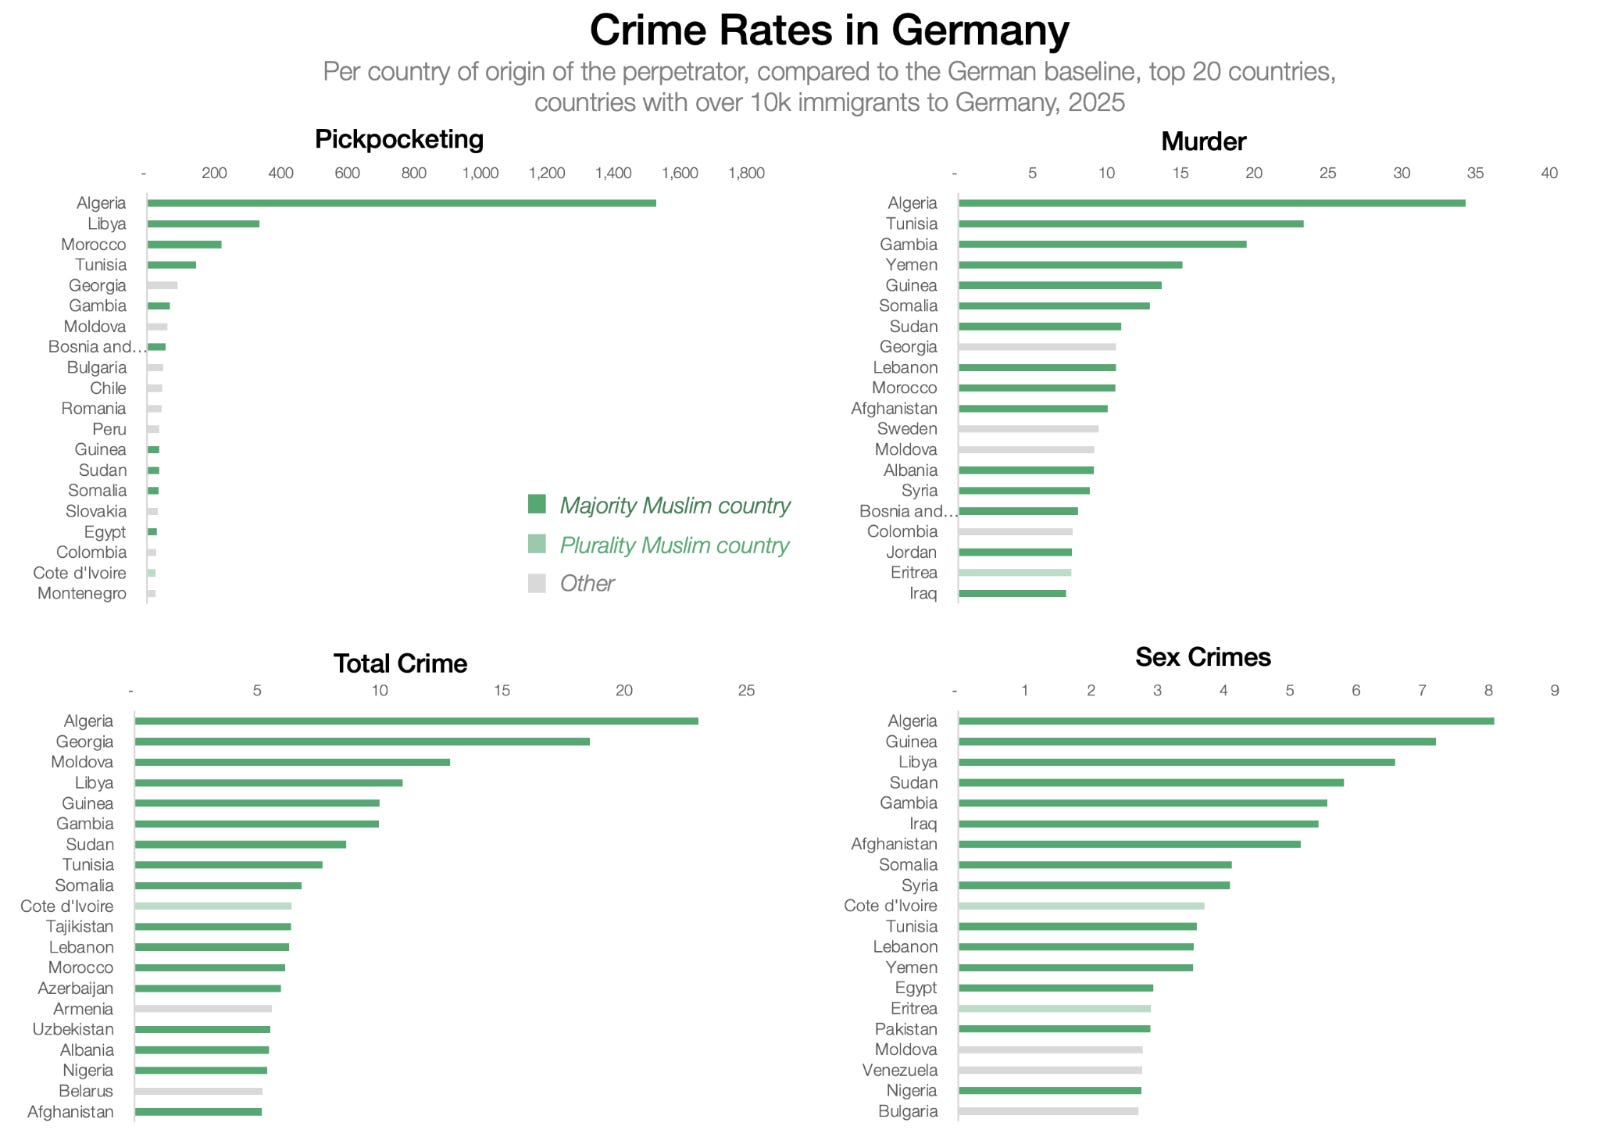
As you can see, green (Muslim) is at the top of all the rankings, with special mention for the winner, Algeria, with the brutal record of one crime for every three Algerians every year. Algerians are ~1500x times more likely to be a pickpocket than Germans, to murder at 35x the rate of Germans, to commit 23x more crime overall, and are 8x more likely to commit sex crimes.
Your first reaction might be: Yeah but that’s not because they’re Muslim; it’s because they’re poor. That’s a good thought to have:
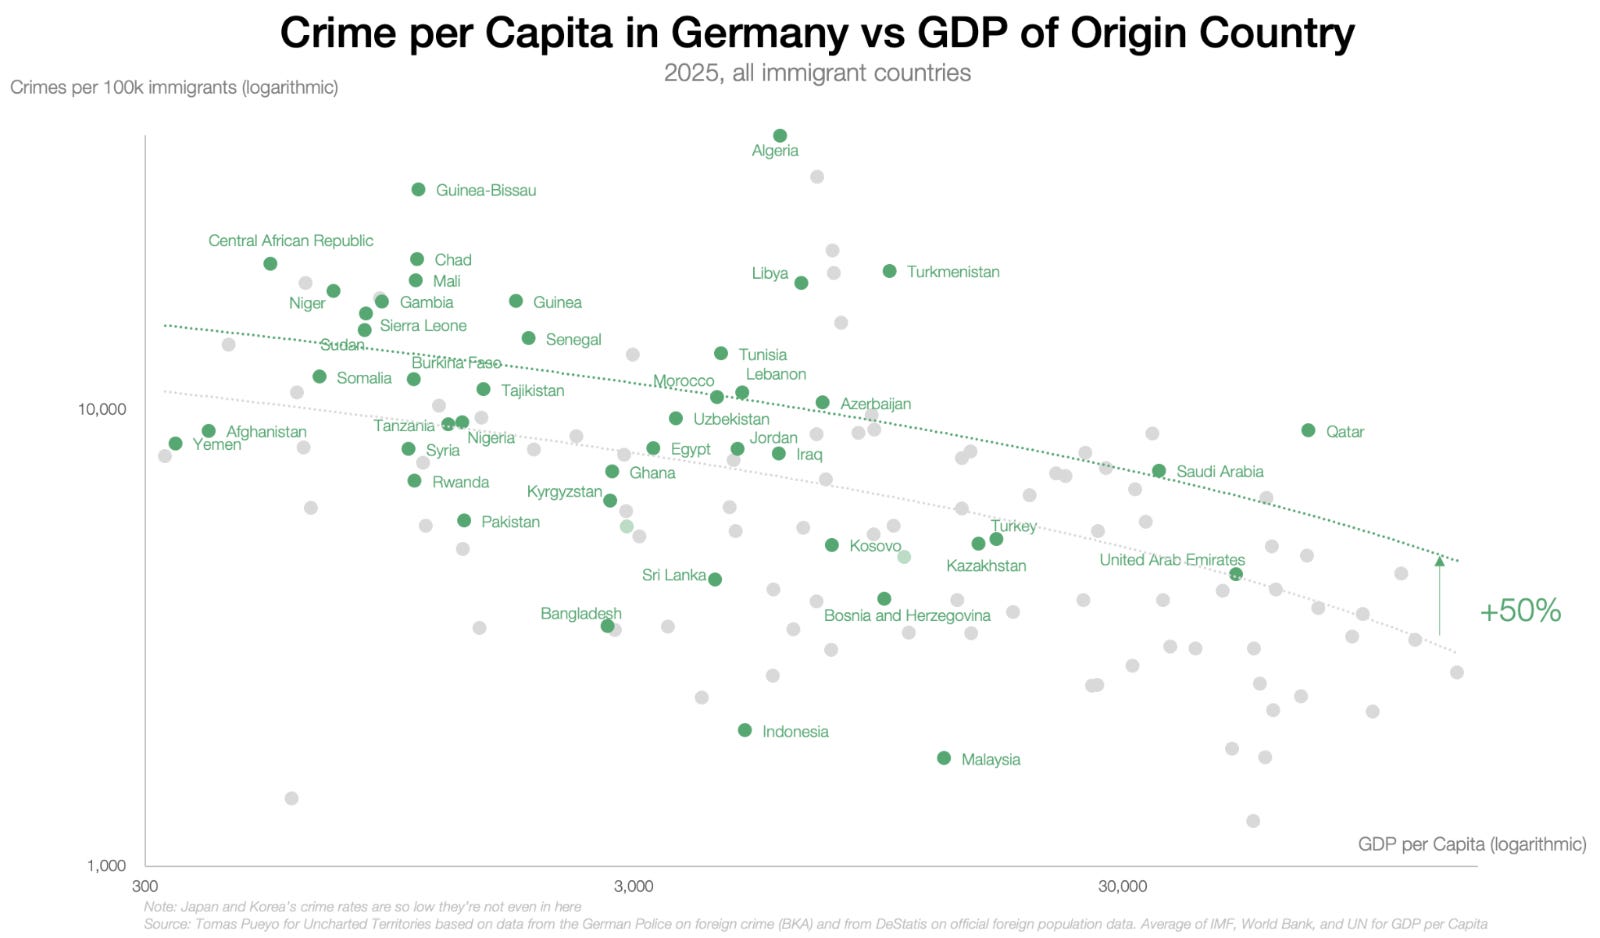
Indeed immigrants from poor countries tend to commit more crime, but there’s plenty of confounders: human capital, culture, education, age, sex, labor-market access… Some poor countries don’t commit any crime (eg Madagascar), and other countries with the same GDP per capita commit dramatically more crime (eg, Central African Republic).
So is it more the money, or the human capital from the country? A recent Finnish study gave some random families $600/month for a couple of years and measured the impact on crime. It was 0%. This paper showed that the link between inequality and crime is basically zero. More inequality doesn’t mean more crime.
The trendlines on the graph suggest that immigrants from Muslim countries commit on average +50% crime vs those of other countries, but that might be because of more conflict in the origin countries (eg, Syria, Afghanistan, Somalia), more asylum seekers vs economic workers, the fact that a majority of them are men… Conversely, Indonesian and Malay immigrants tend to be Muslim too, but their crime rate is extremely low.
So both income and religion probably are part of the picture, but they’re definitely not the entire picture.
Denmark
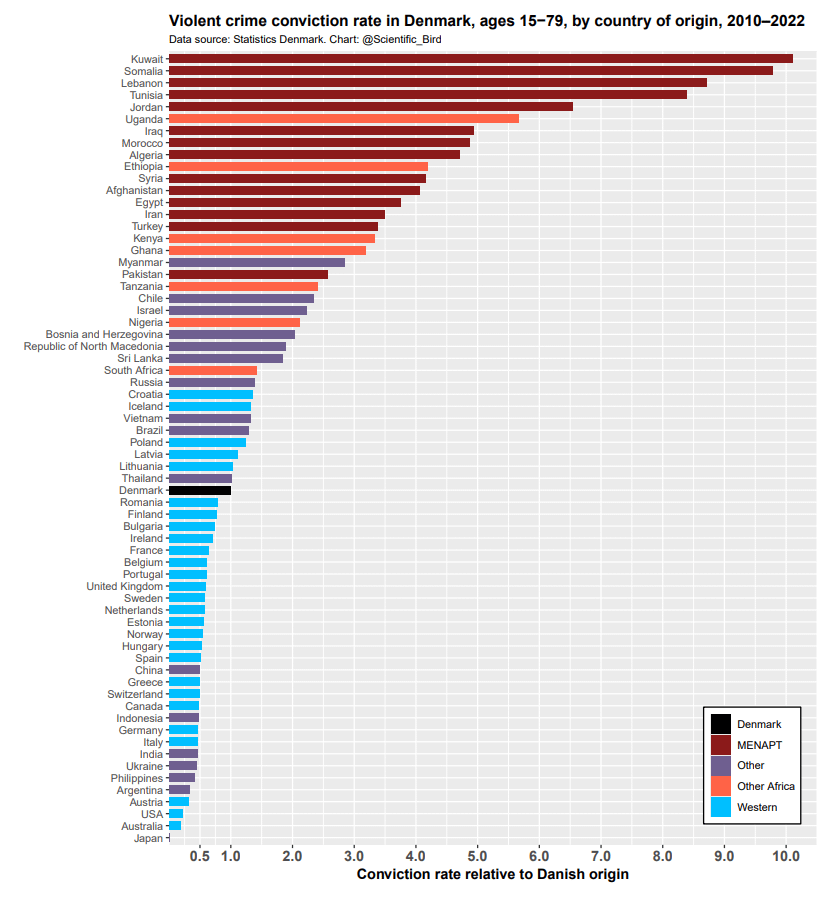
Here, they corrected for age and sex of the immigrants.:
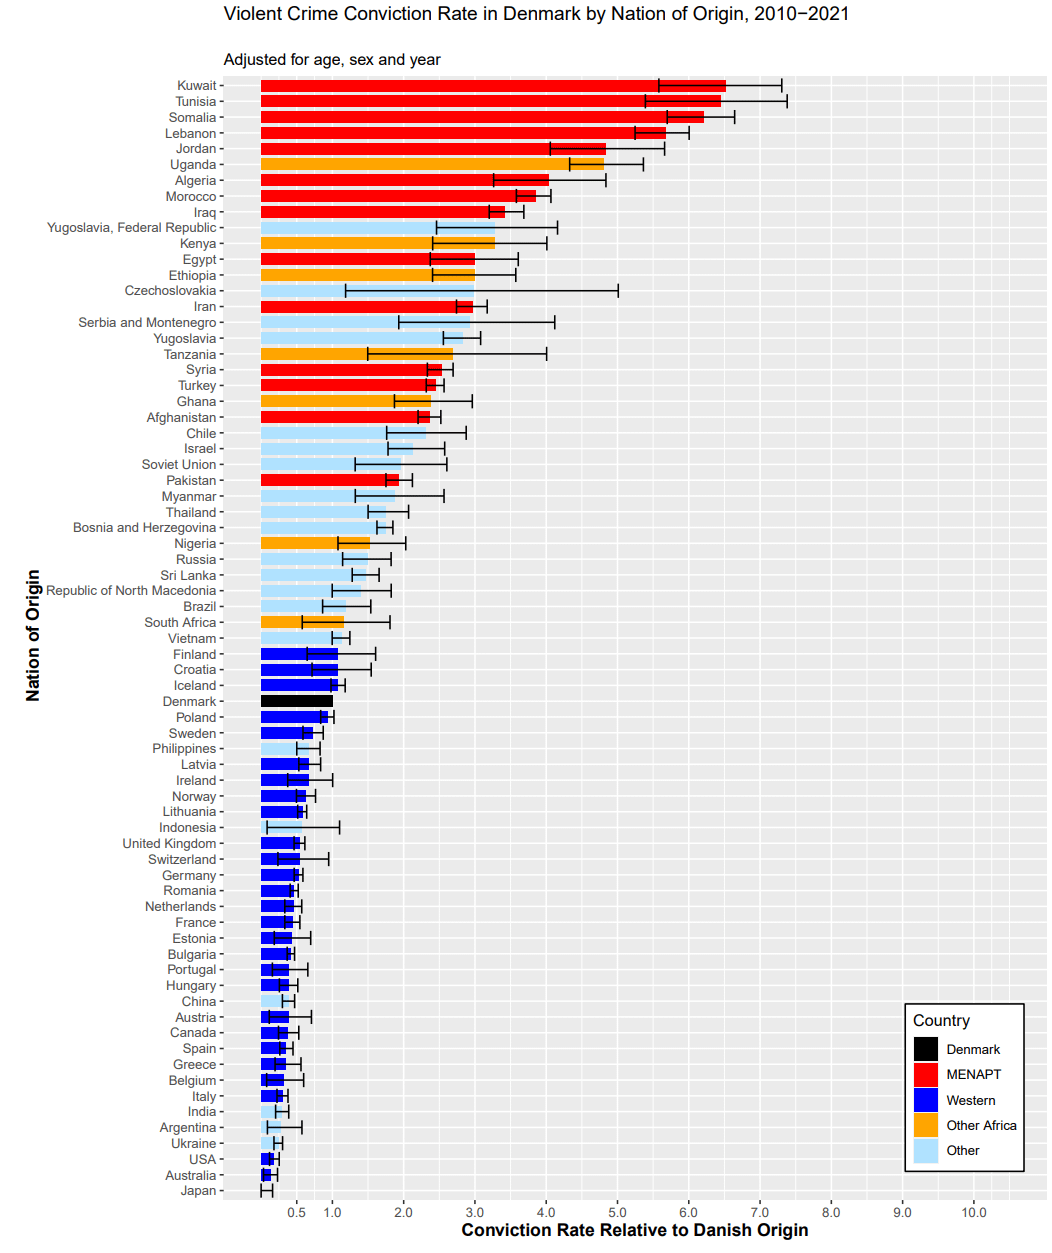
As you can see, this does reduce the crime rate of immigrants vs the baseline, but doesn’t change the overall picture. This tells you that receiving young male immigrants, especially from crime-prone countries, is a way to dramatically increase the crime rate.
This Danish report showed that a few hundred Palestinians were accepted into Denmark in 1992 under a special law. Of them, about 64% had criminal records: 21% ended up in prison, and 43% got at least one large fine.2 About 59% were on welfare. Of their children, 34% have been convicted of a crime, 13% received a prison sentence.
Here’s a breakdown per type of crime:
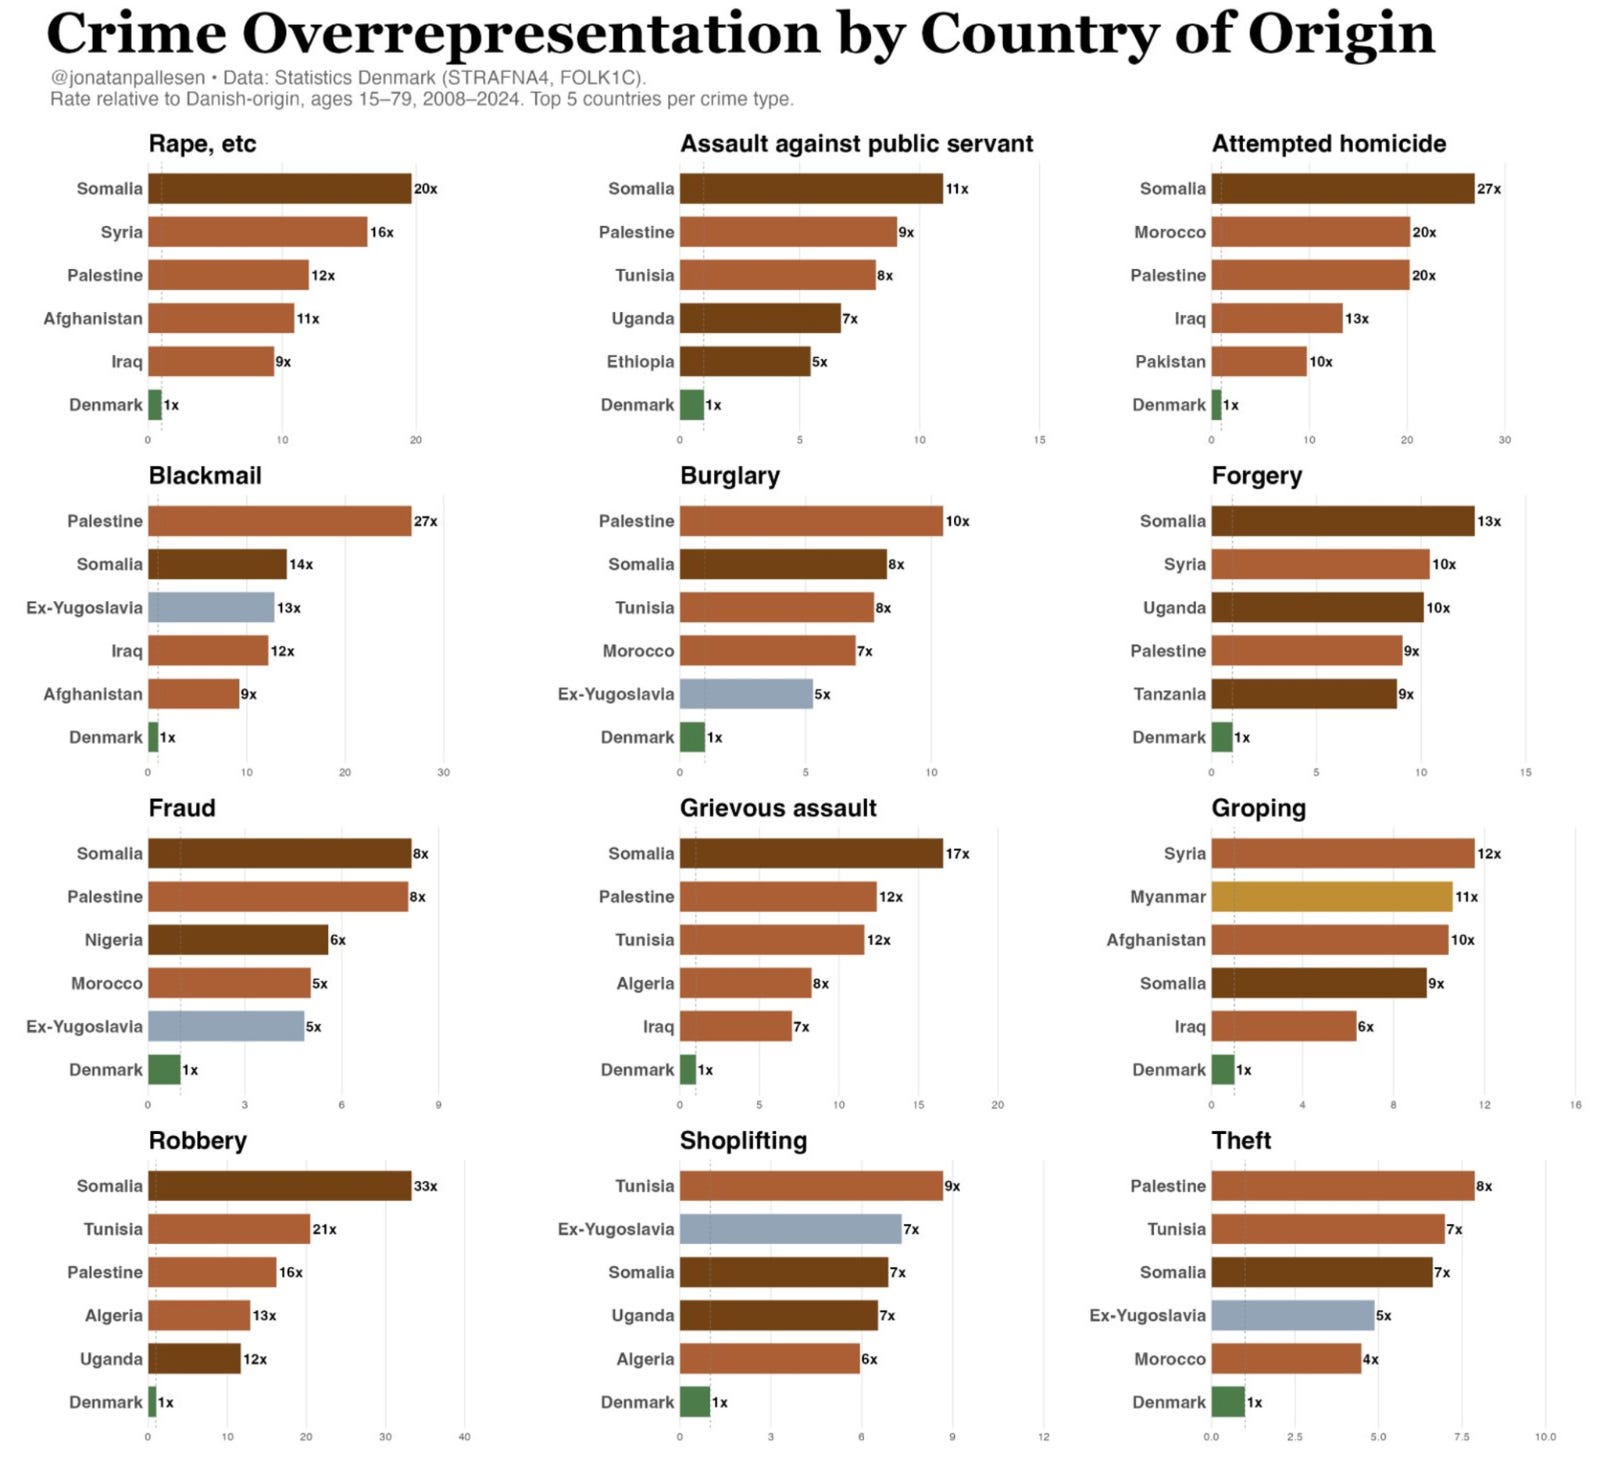
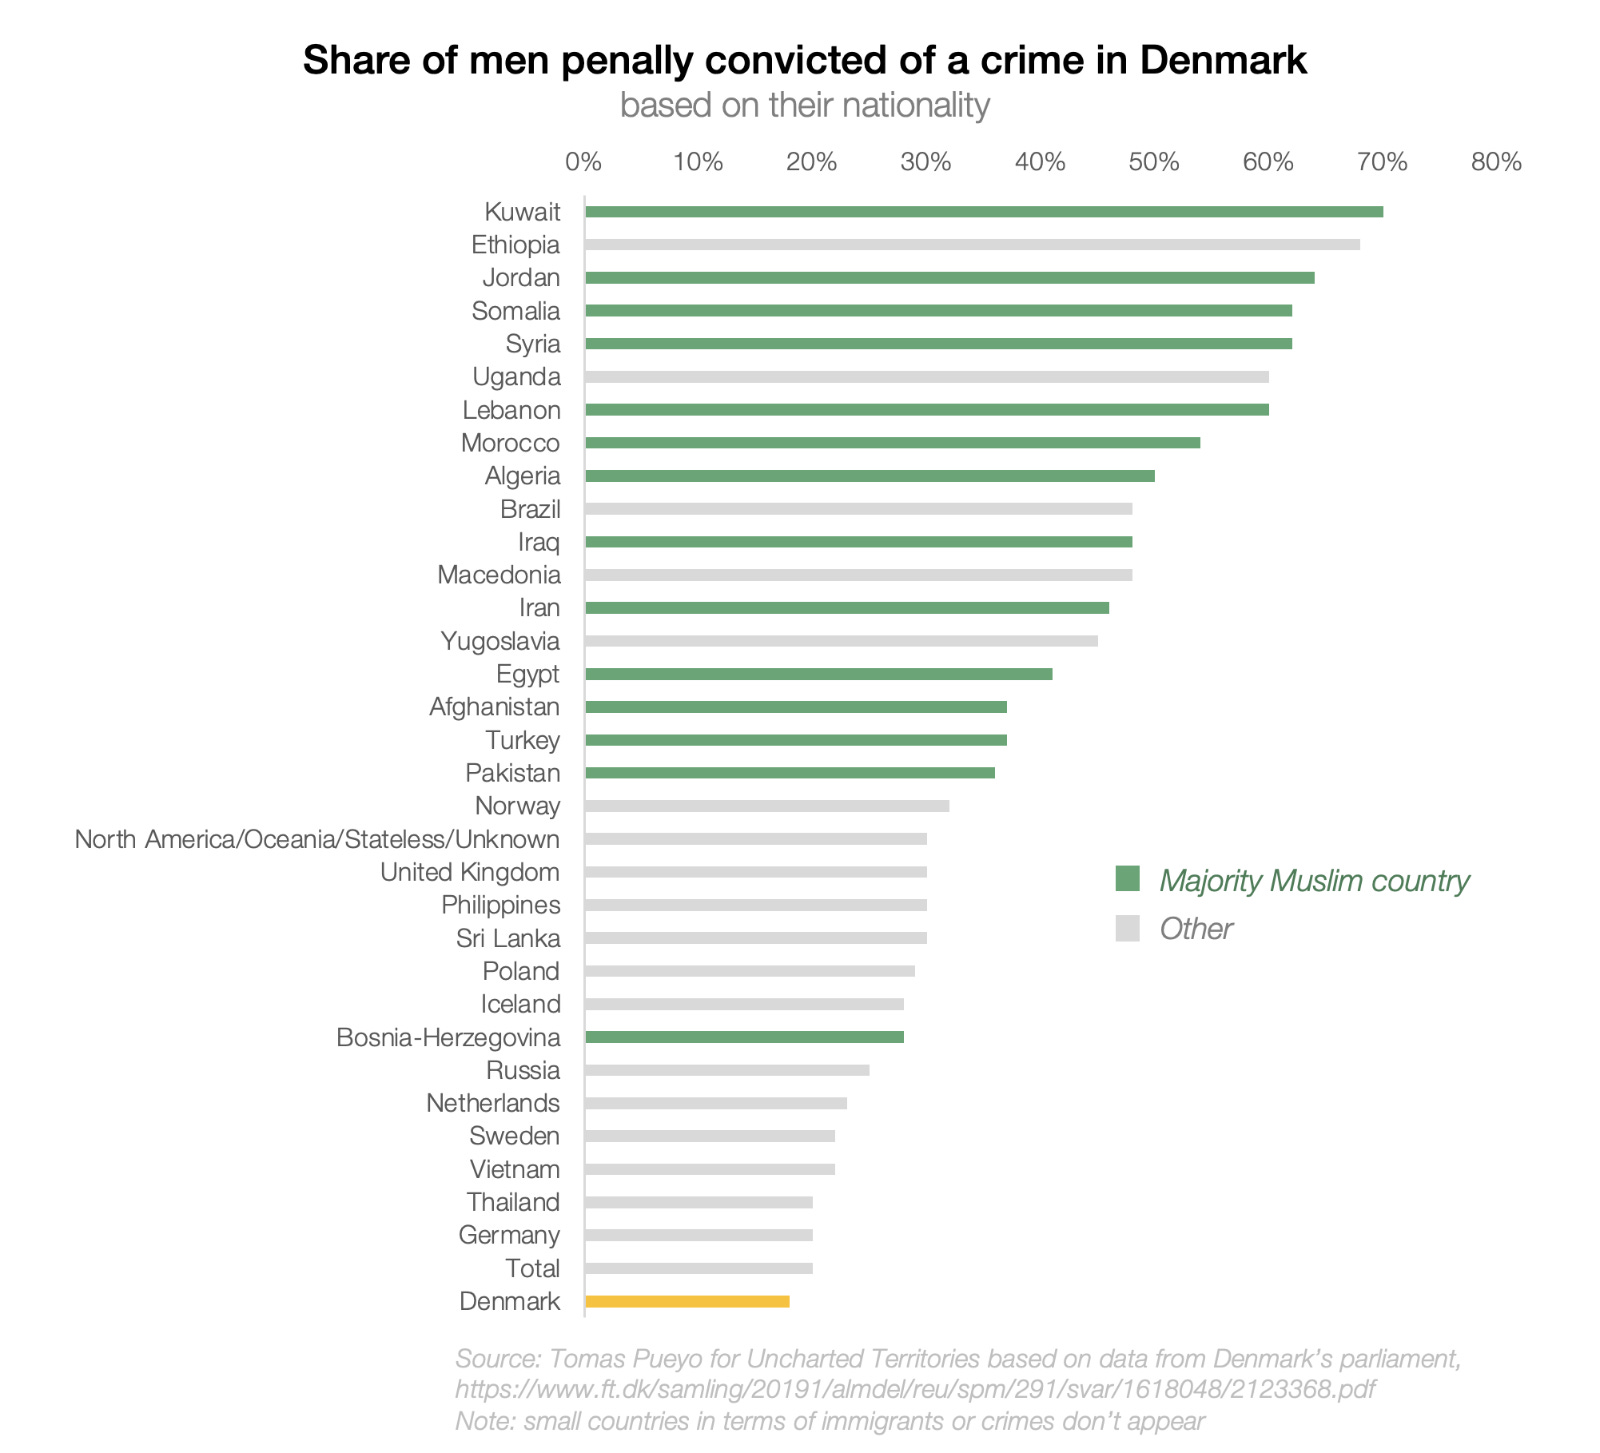
The Danish Parliament looked at the share of men born in 1987 who had been penally convicted of a crime by the time they were 30, and this is what it found:
Sweden
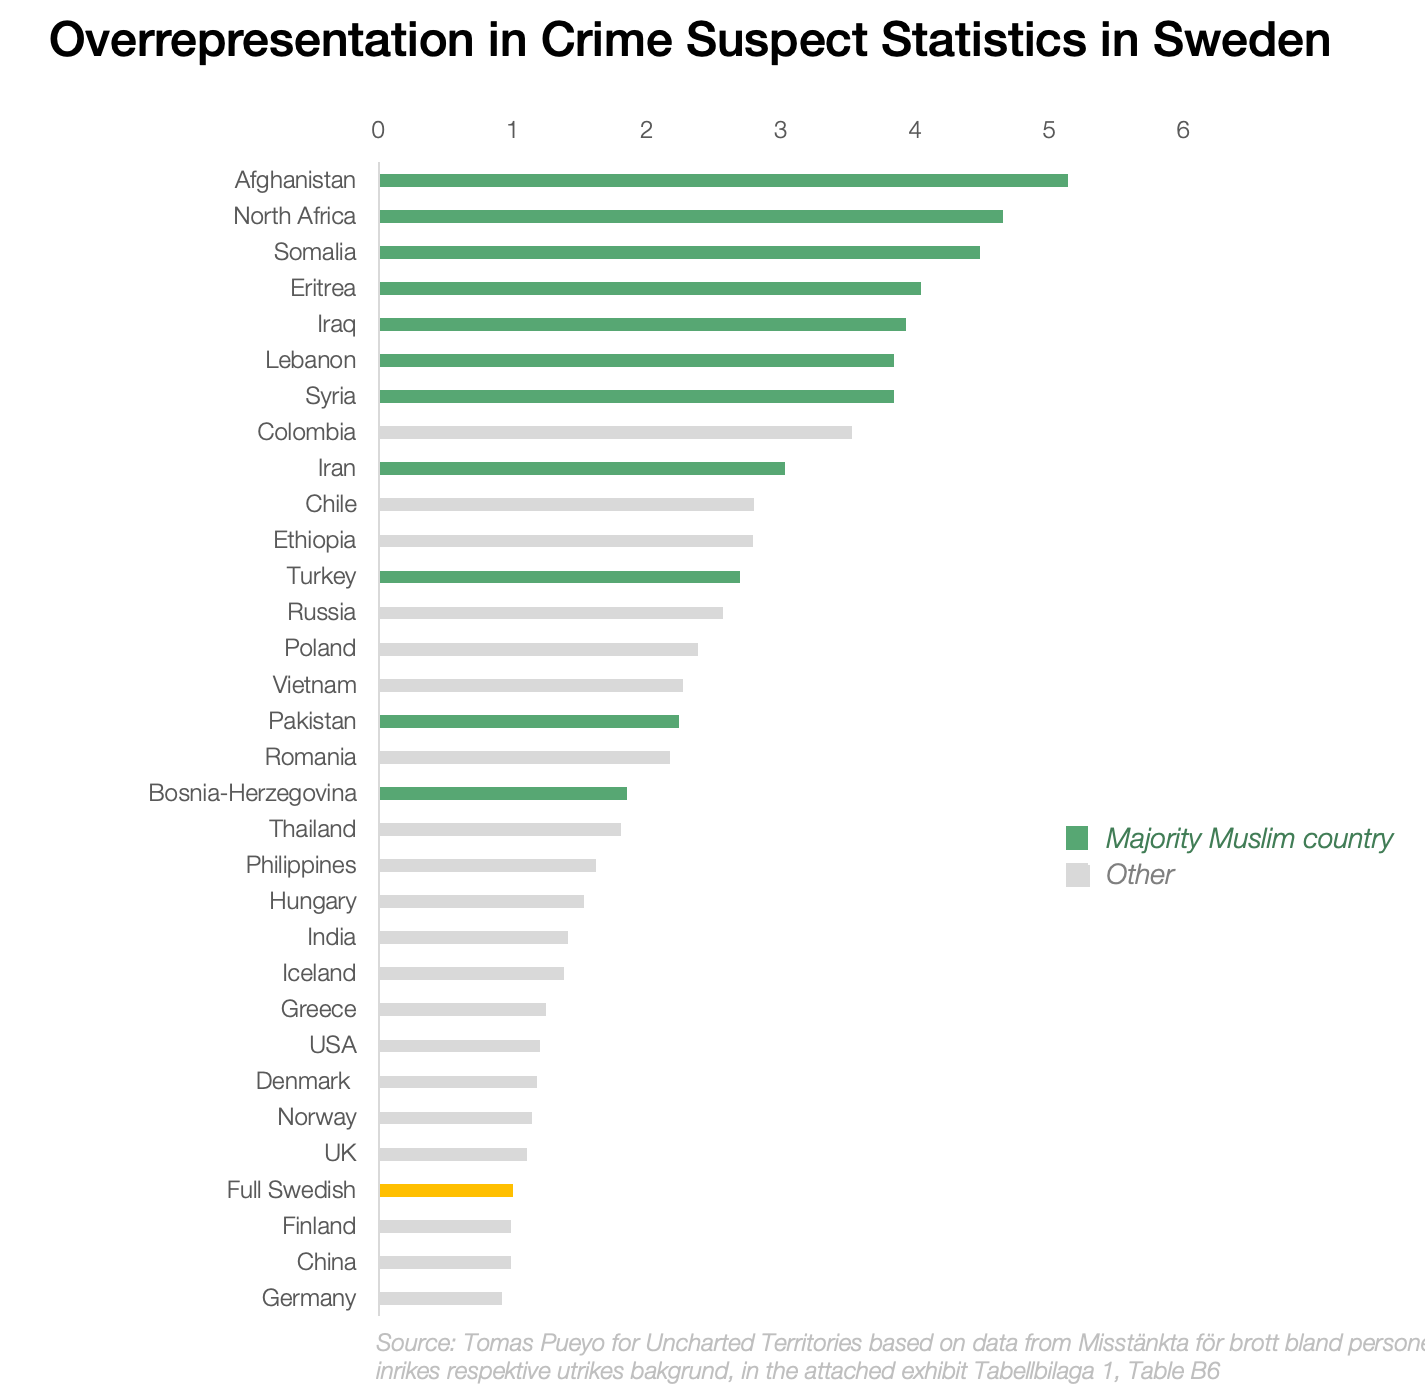
Sweden doesn’t have much data, but I was able to find some from the official Swedish National Council for Crime Prevention.
Spain
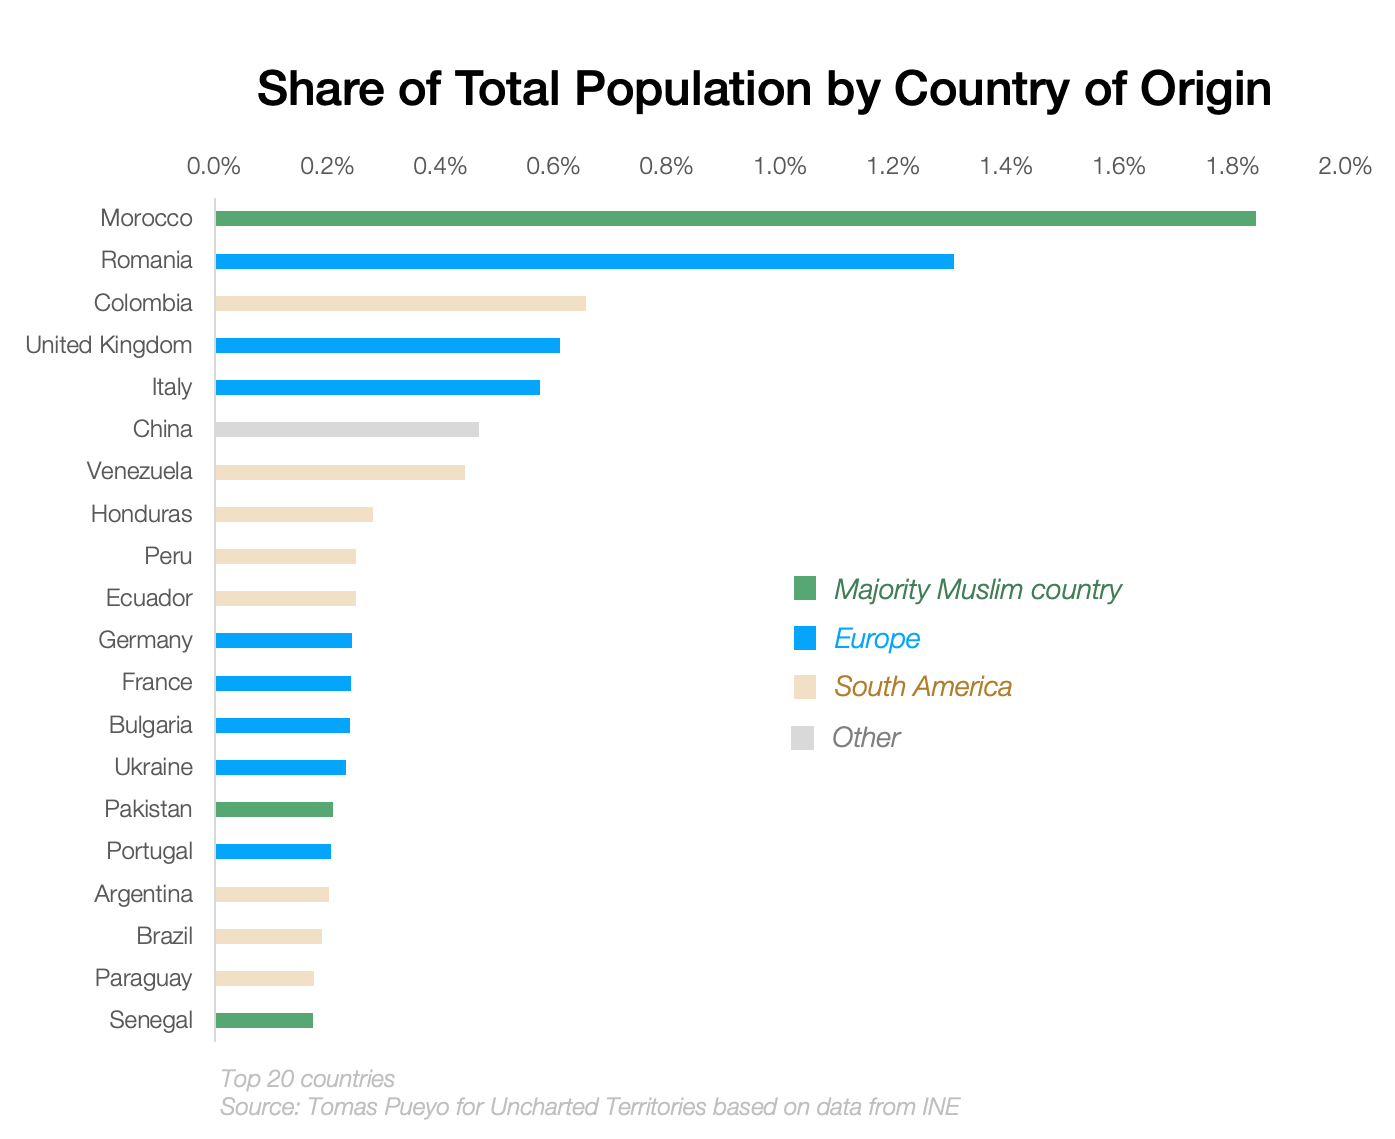
Spain is interesting because, unlike most other European countries, it attracts a much more diverse mix of immigrants.
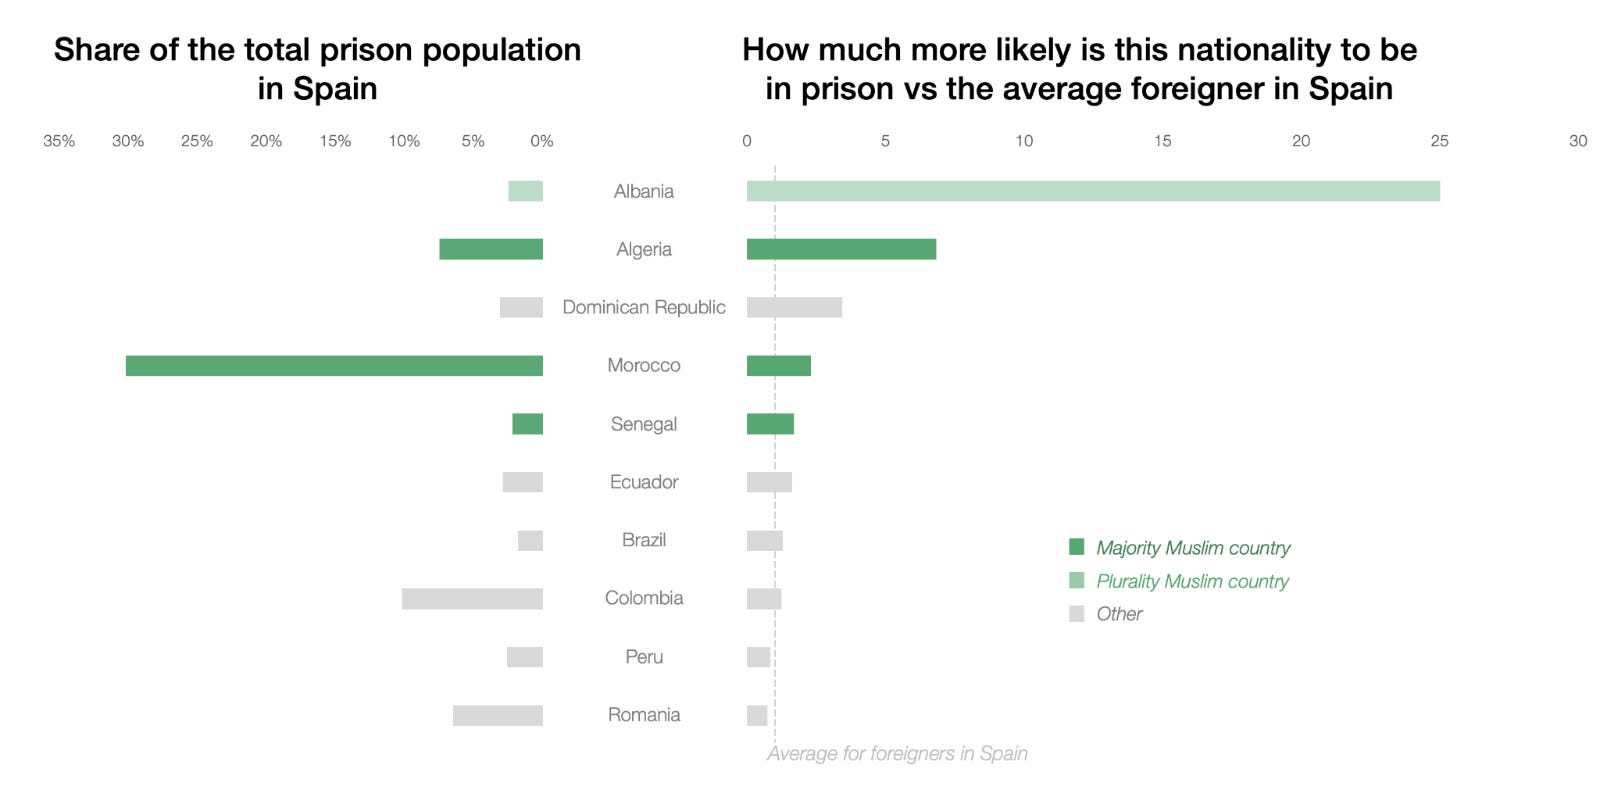
However, in Spain, four of the top five most crime-prone countries of origin are Muslim.3
Finland
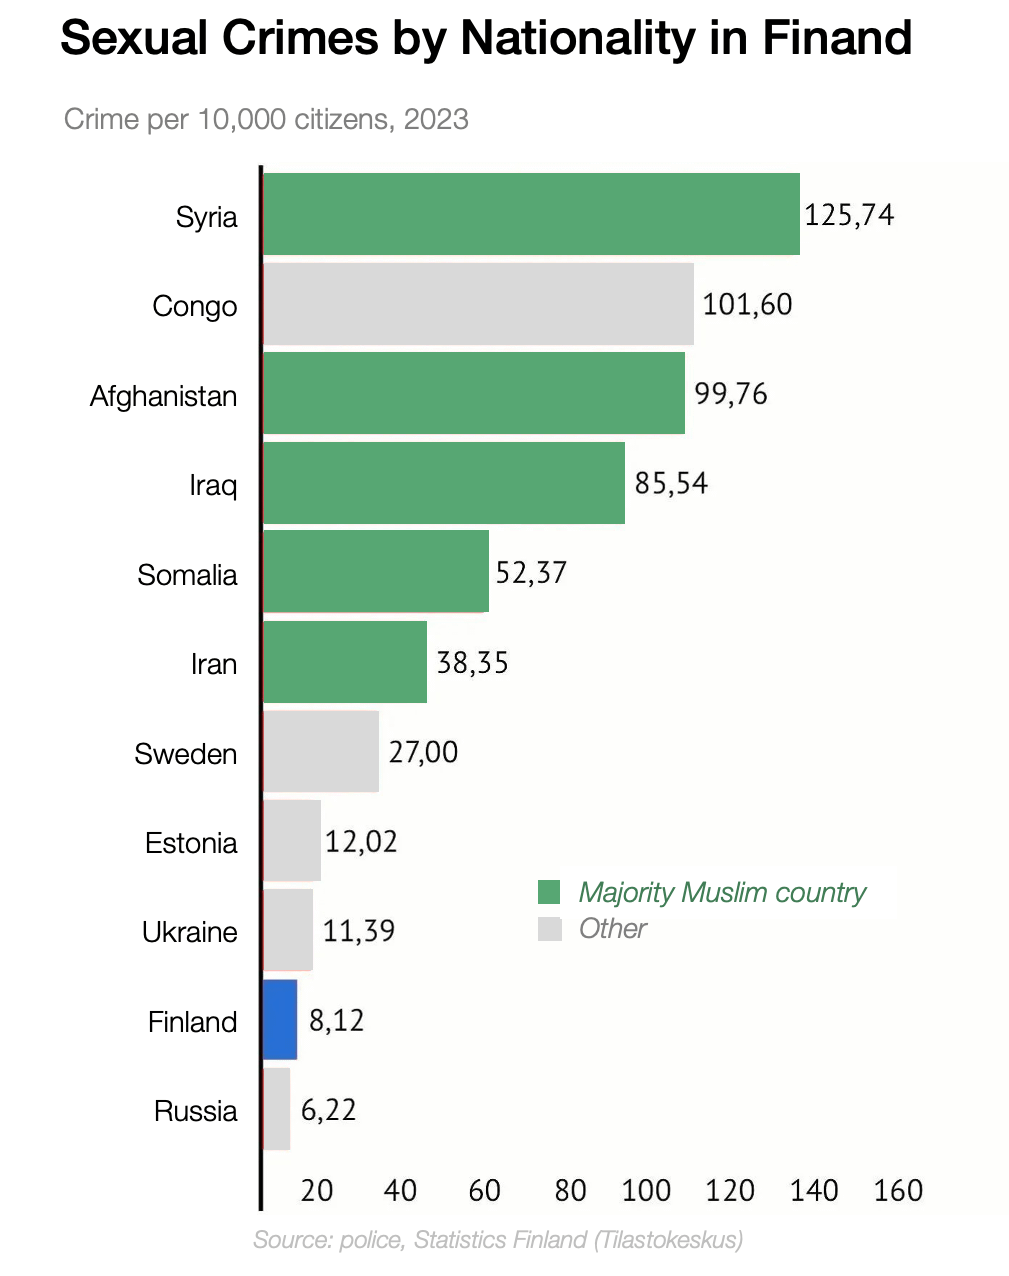
Here’s what I found for Finland.
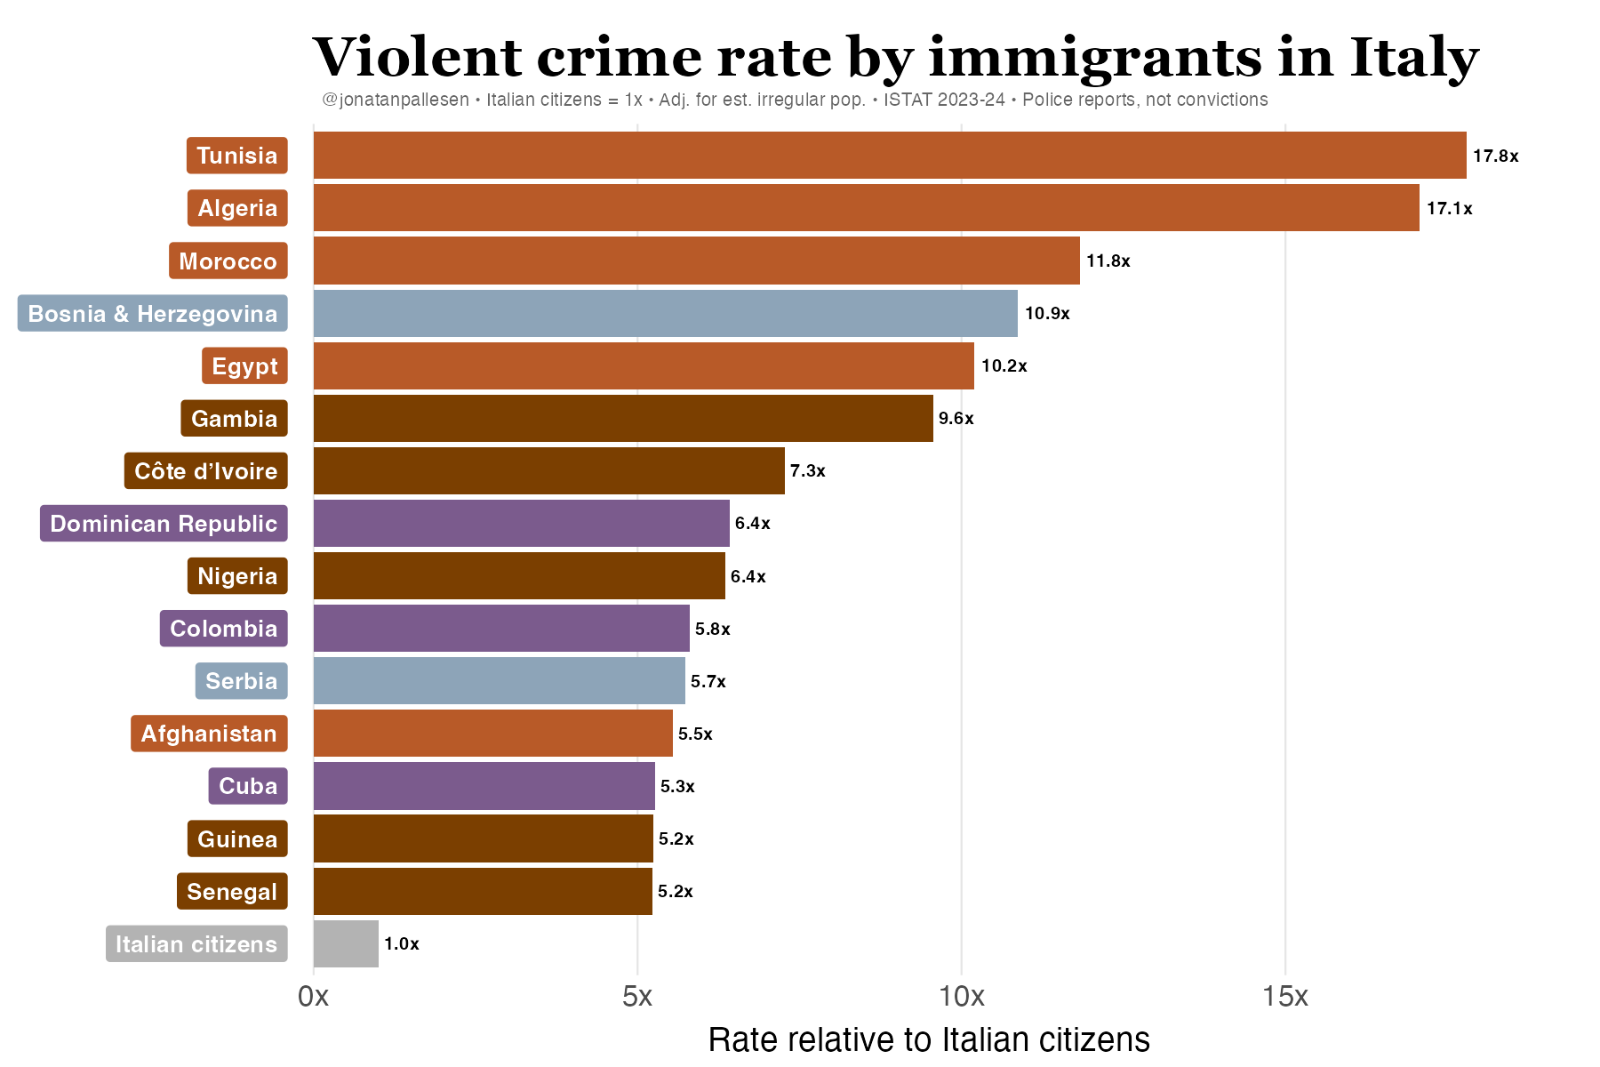
Italy
And for Italy:
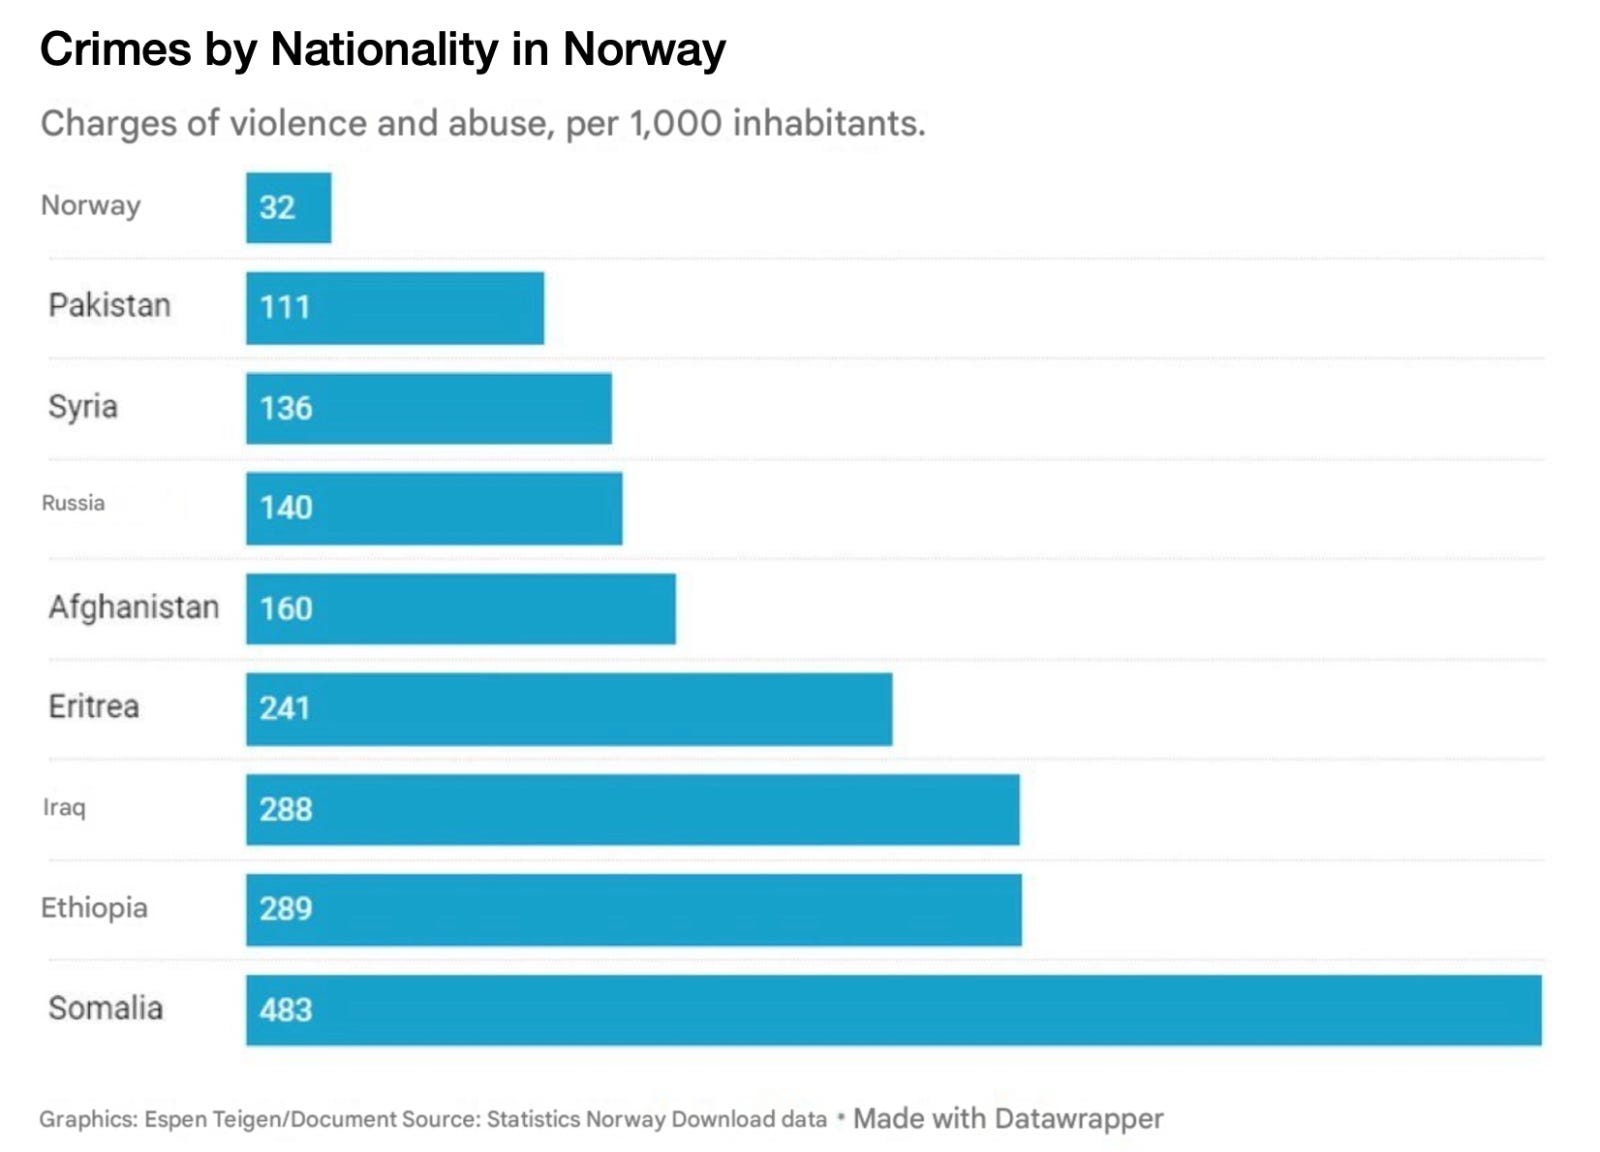
Norway
In Norway:
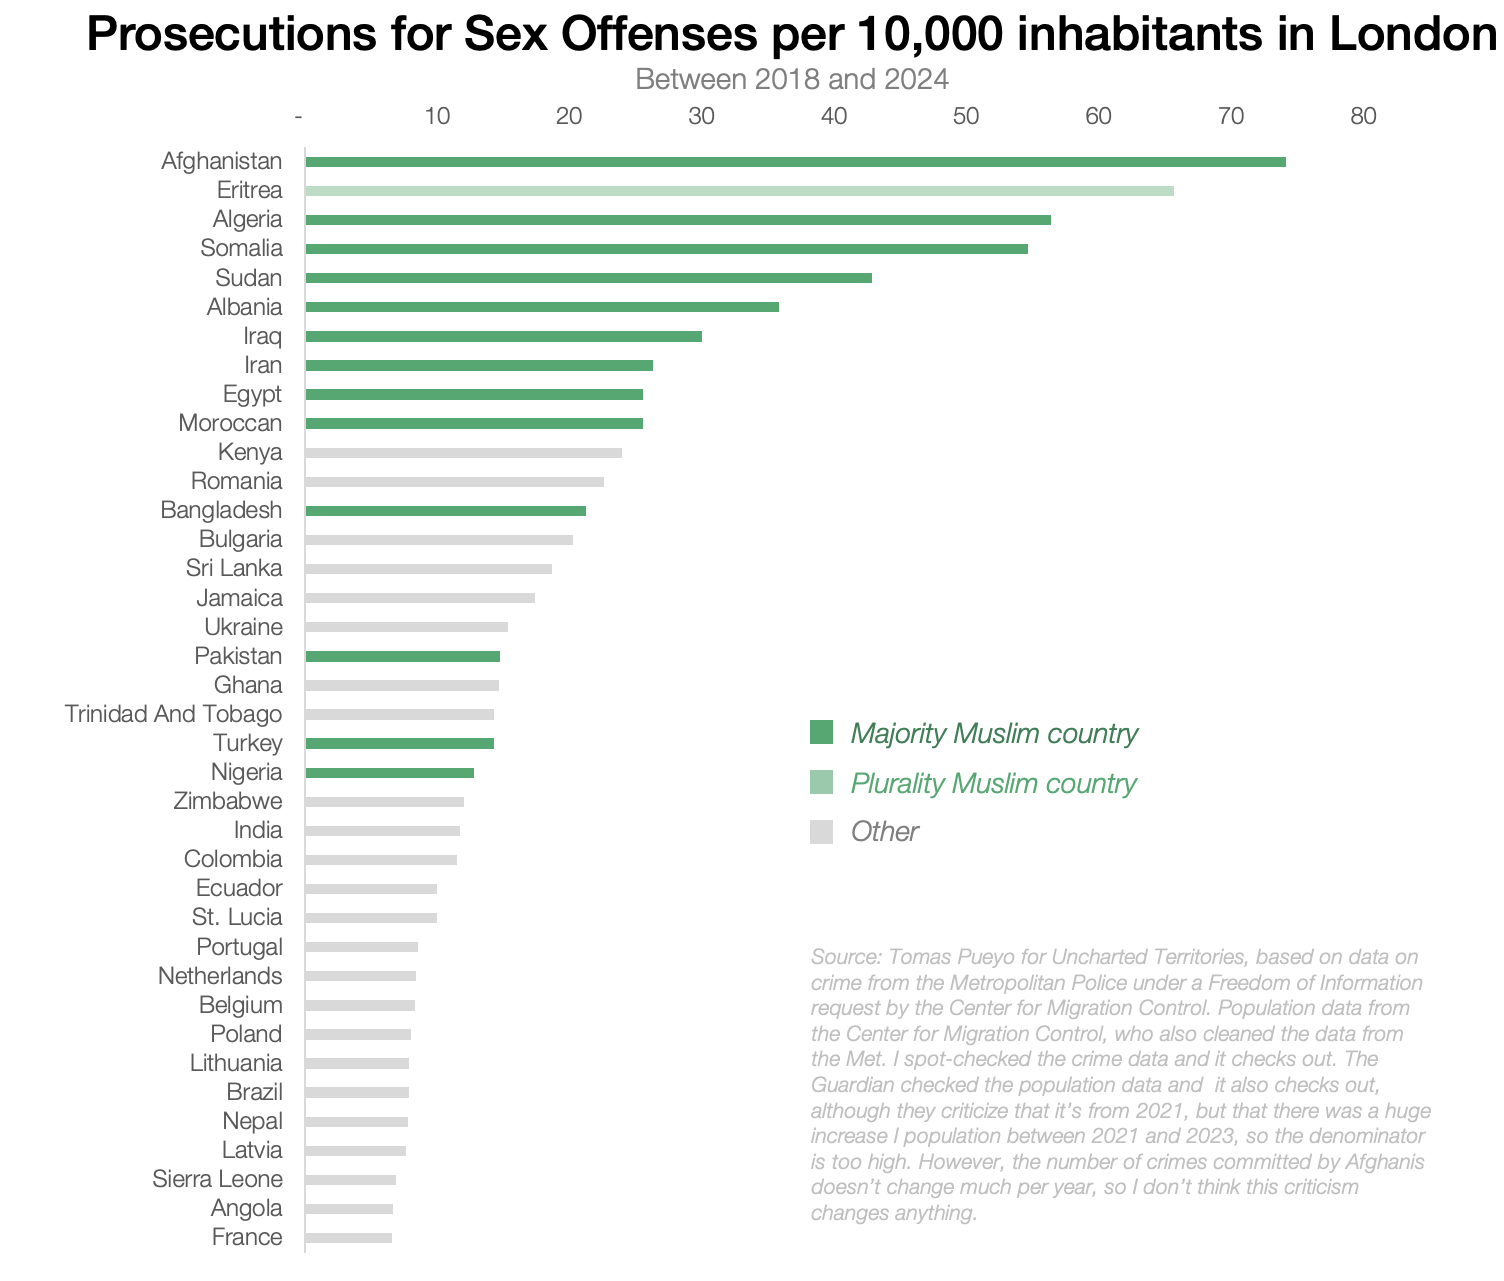
UK
The UK doesn’t have much information, but a freedom of information request to the London Metropolitan Police delivered this data:
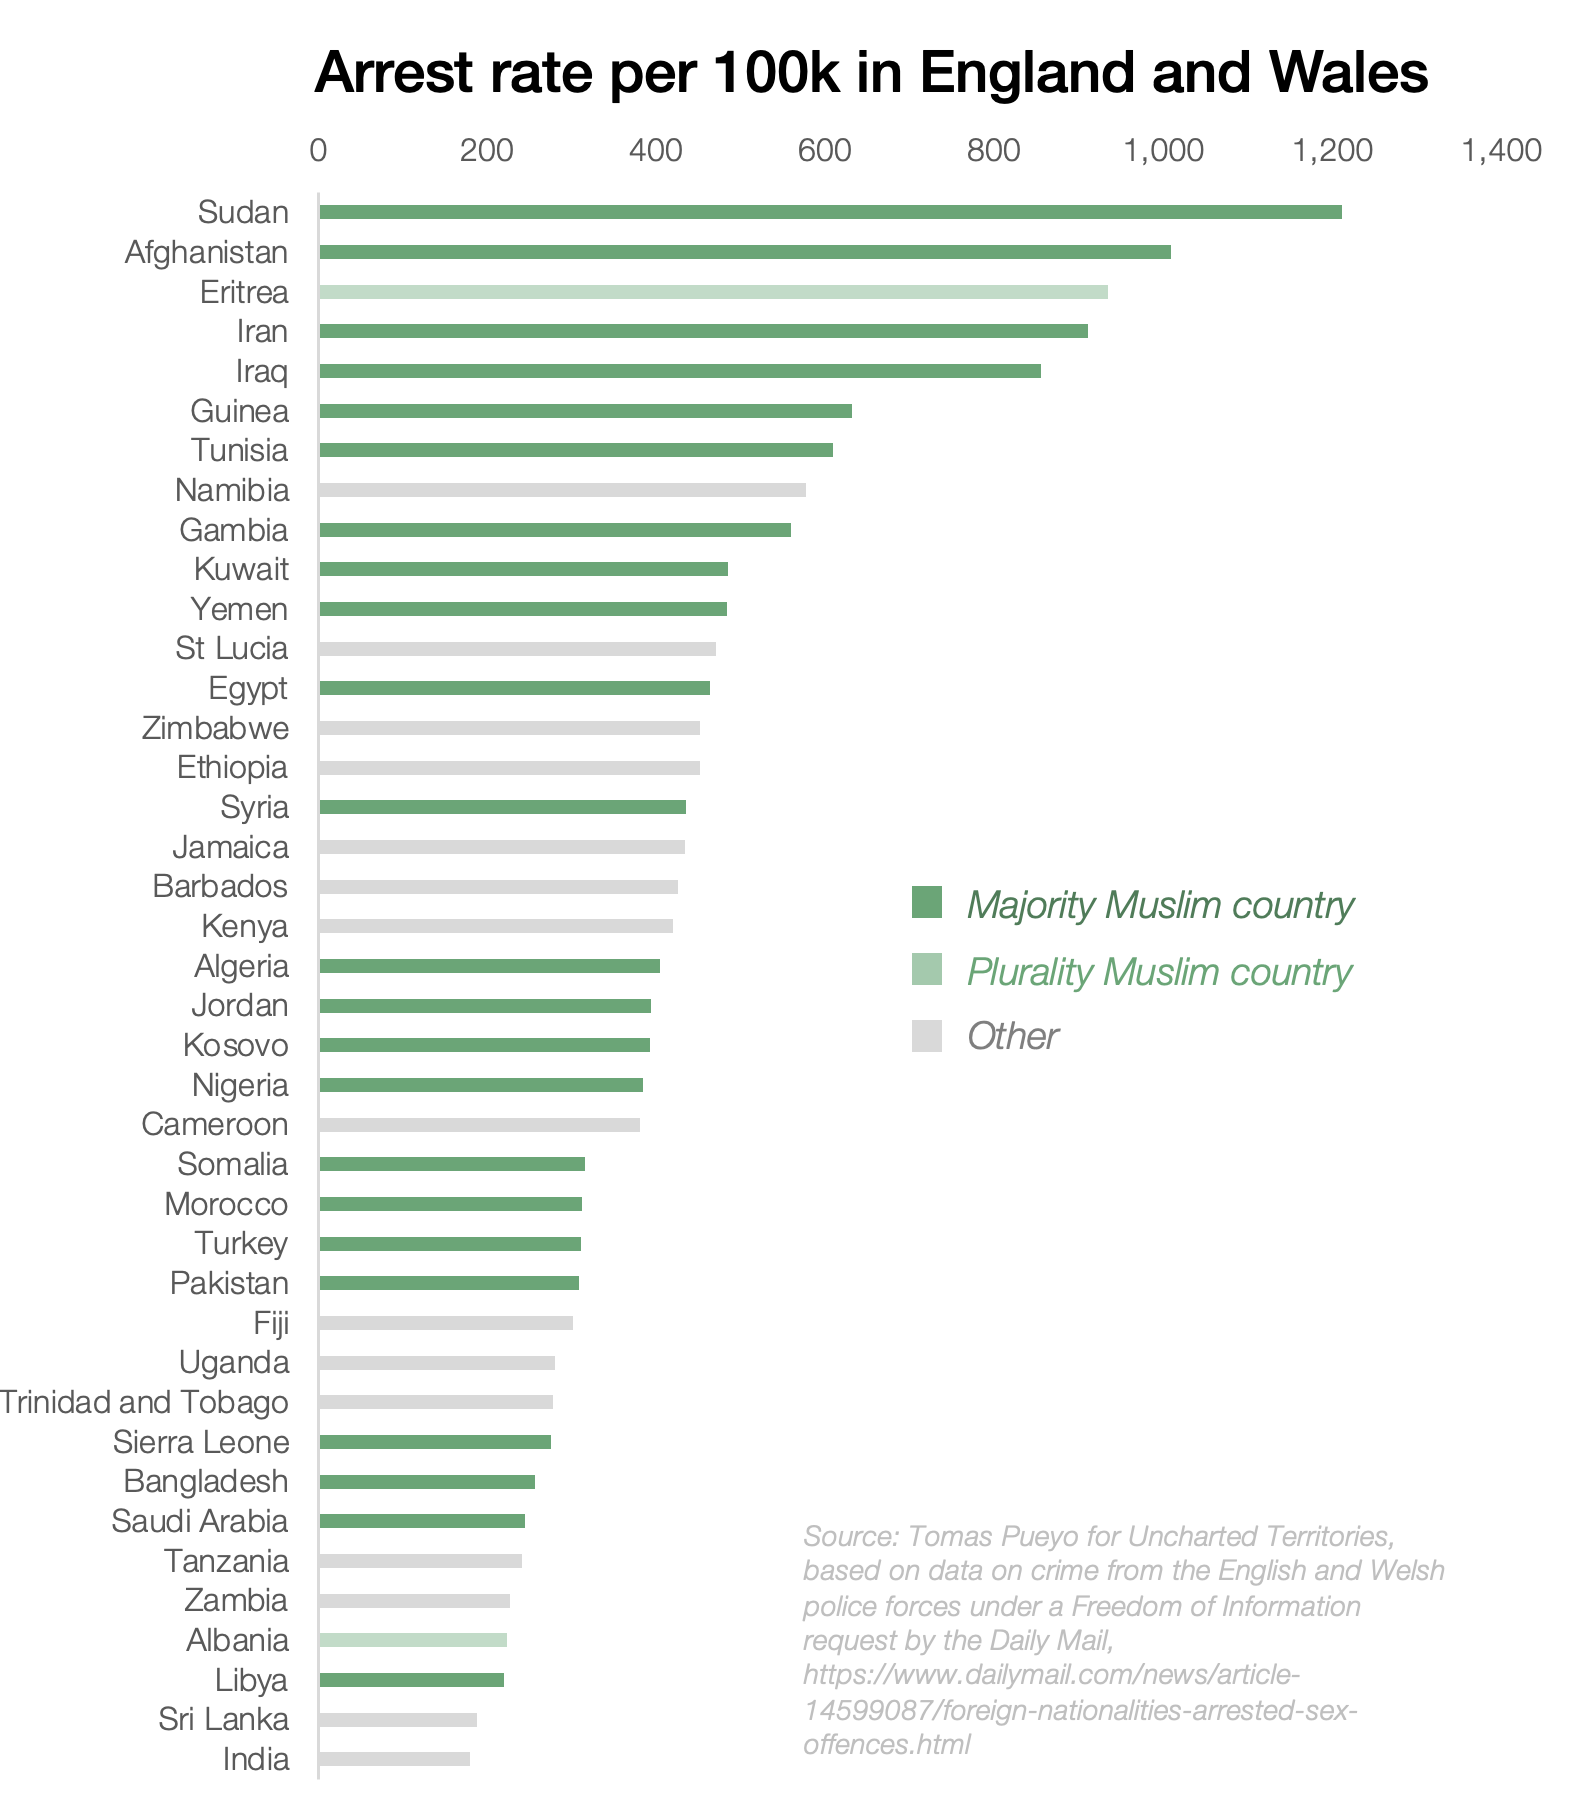
Another Freedom of Information request to English and Welsh police provided this data:
Netherlands
The Netherlands publishes crime data but not per country. There, non-EU immigrants are 4.5x more crime-prone than the Dutch:4 They are 15% of the population but commit ~40% of the crime.
Note that this problem does not seem to exist in the US. There, the share of Muslims is quite small, and most criminals are American (more likely to be criminal than the average immigrant). As you can see, wherever we look in Europe, there’s an overrepresentation of Muslim countries at the top of the crime lists. Controlling for age, sex, and income reduces this effect, but it remains strong. Immigrants in general commit much more crime than locals. Within immigrants, non-EU immigrants are much more crime prone. Within those, Muslim immigrants cause the most crime.
Terrorism
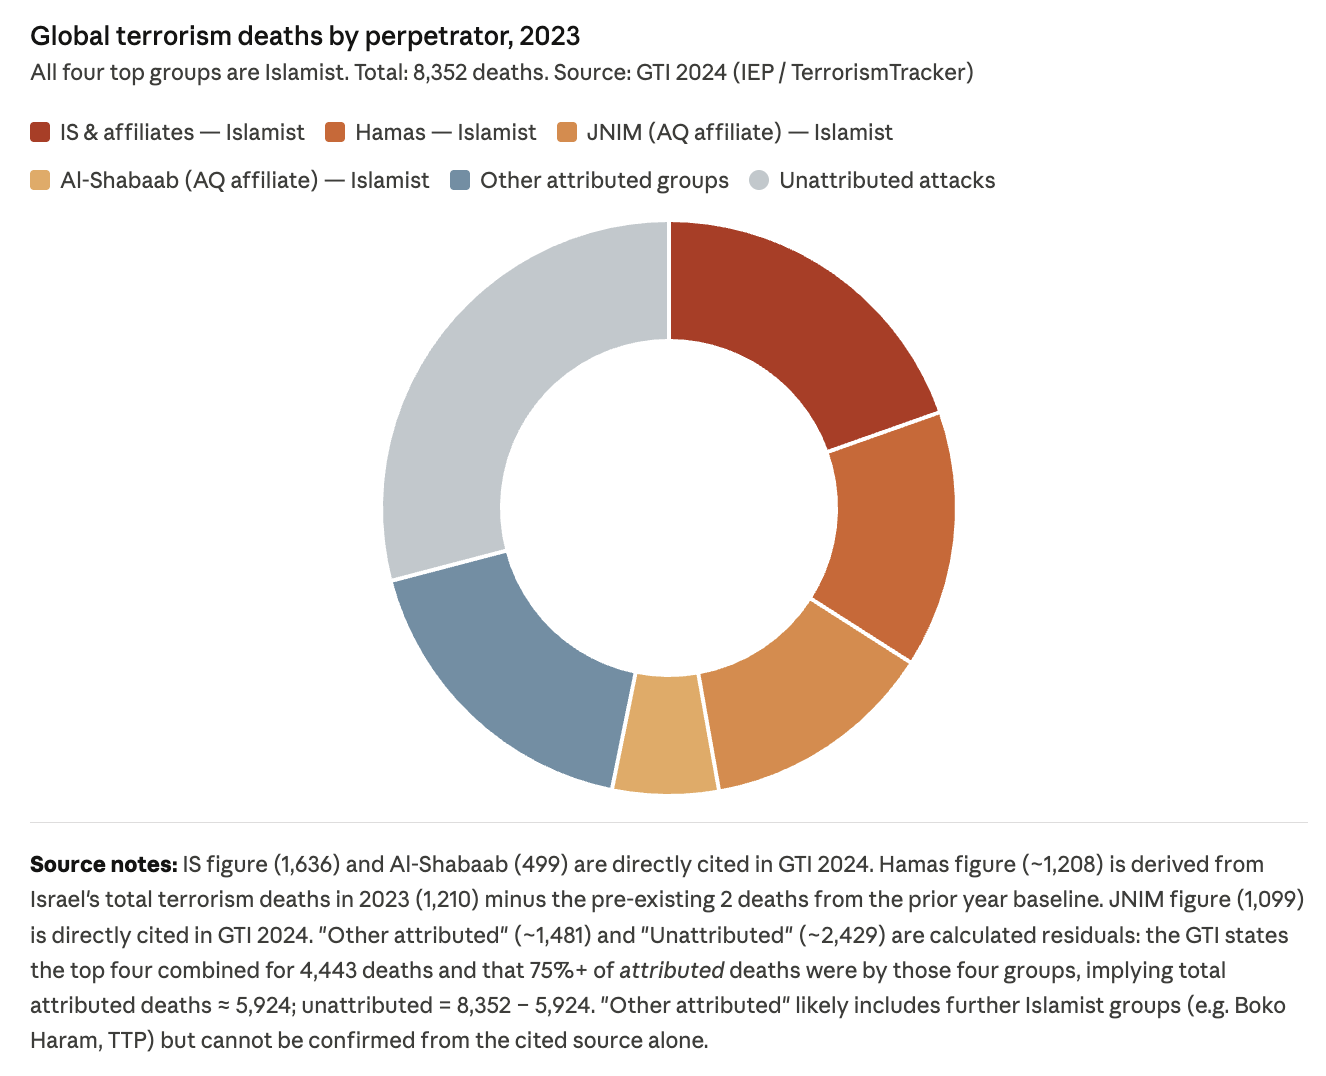
Terrorism data is harder to get because there’s less of it. But we do have some. Around the world, about 75% of terrorism deaths are caused by Islamism.
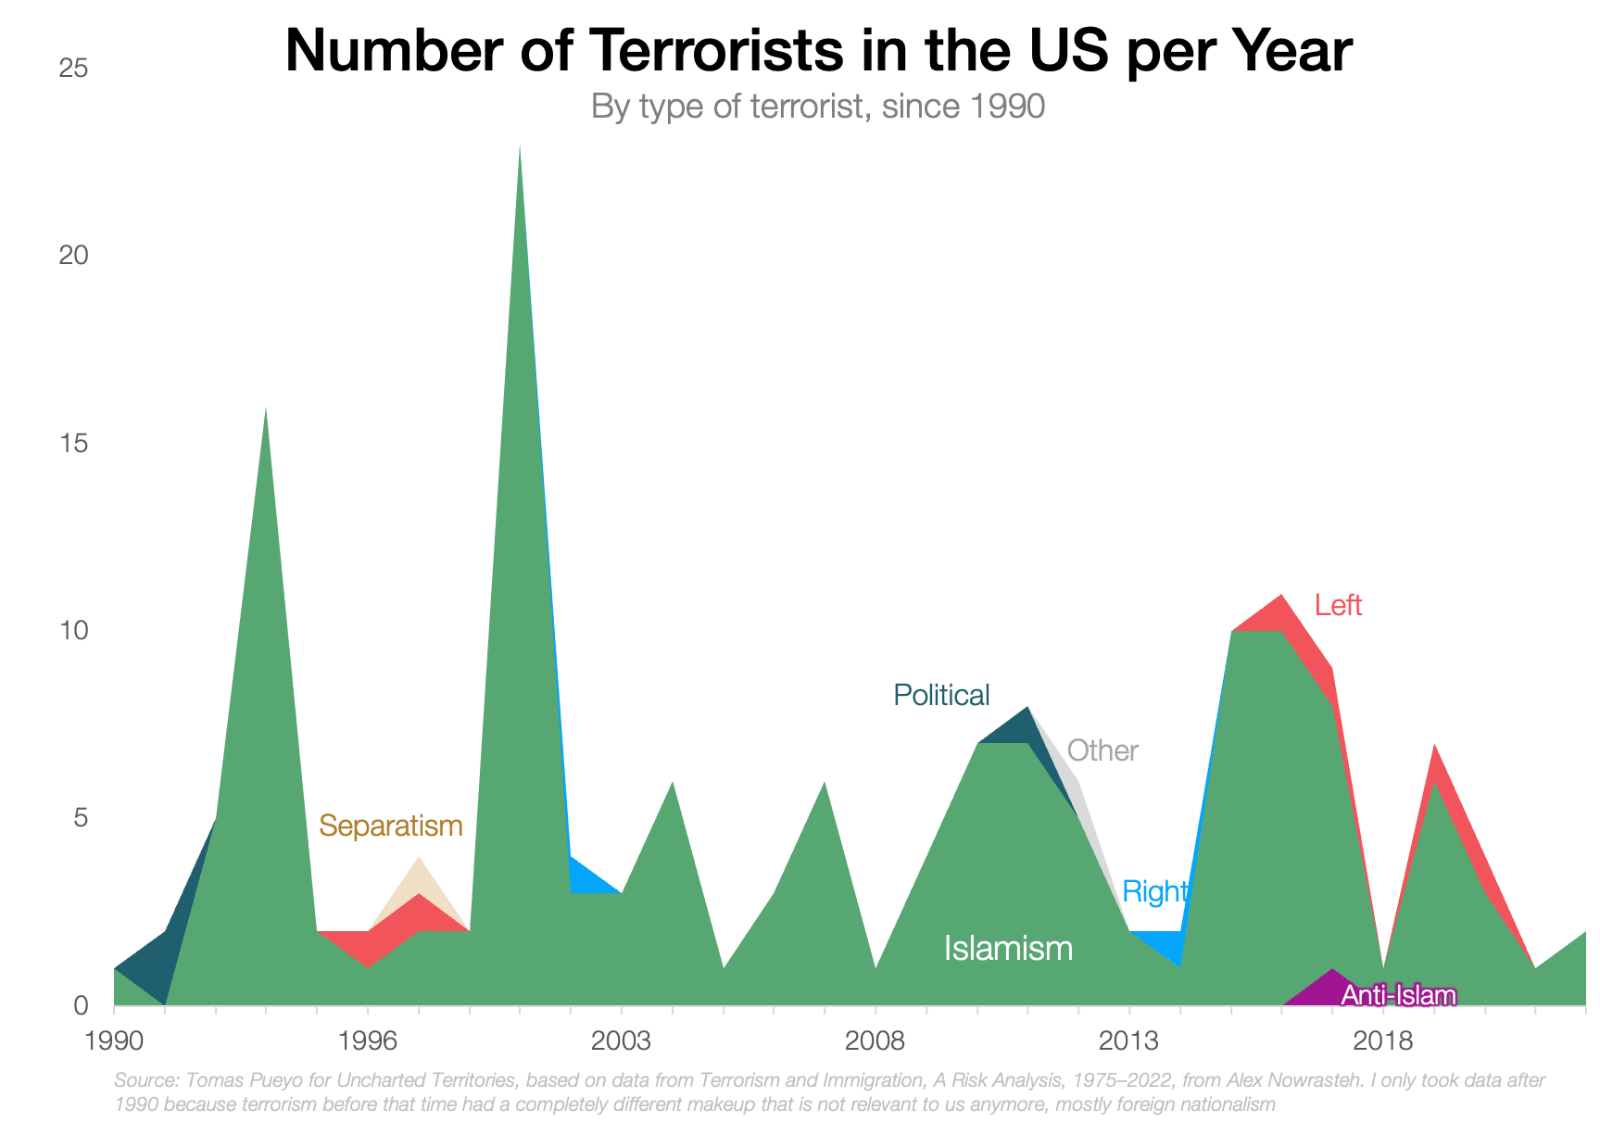
Here are terrorists in the US for the last 30 years, by type of terrorism.
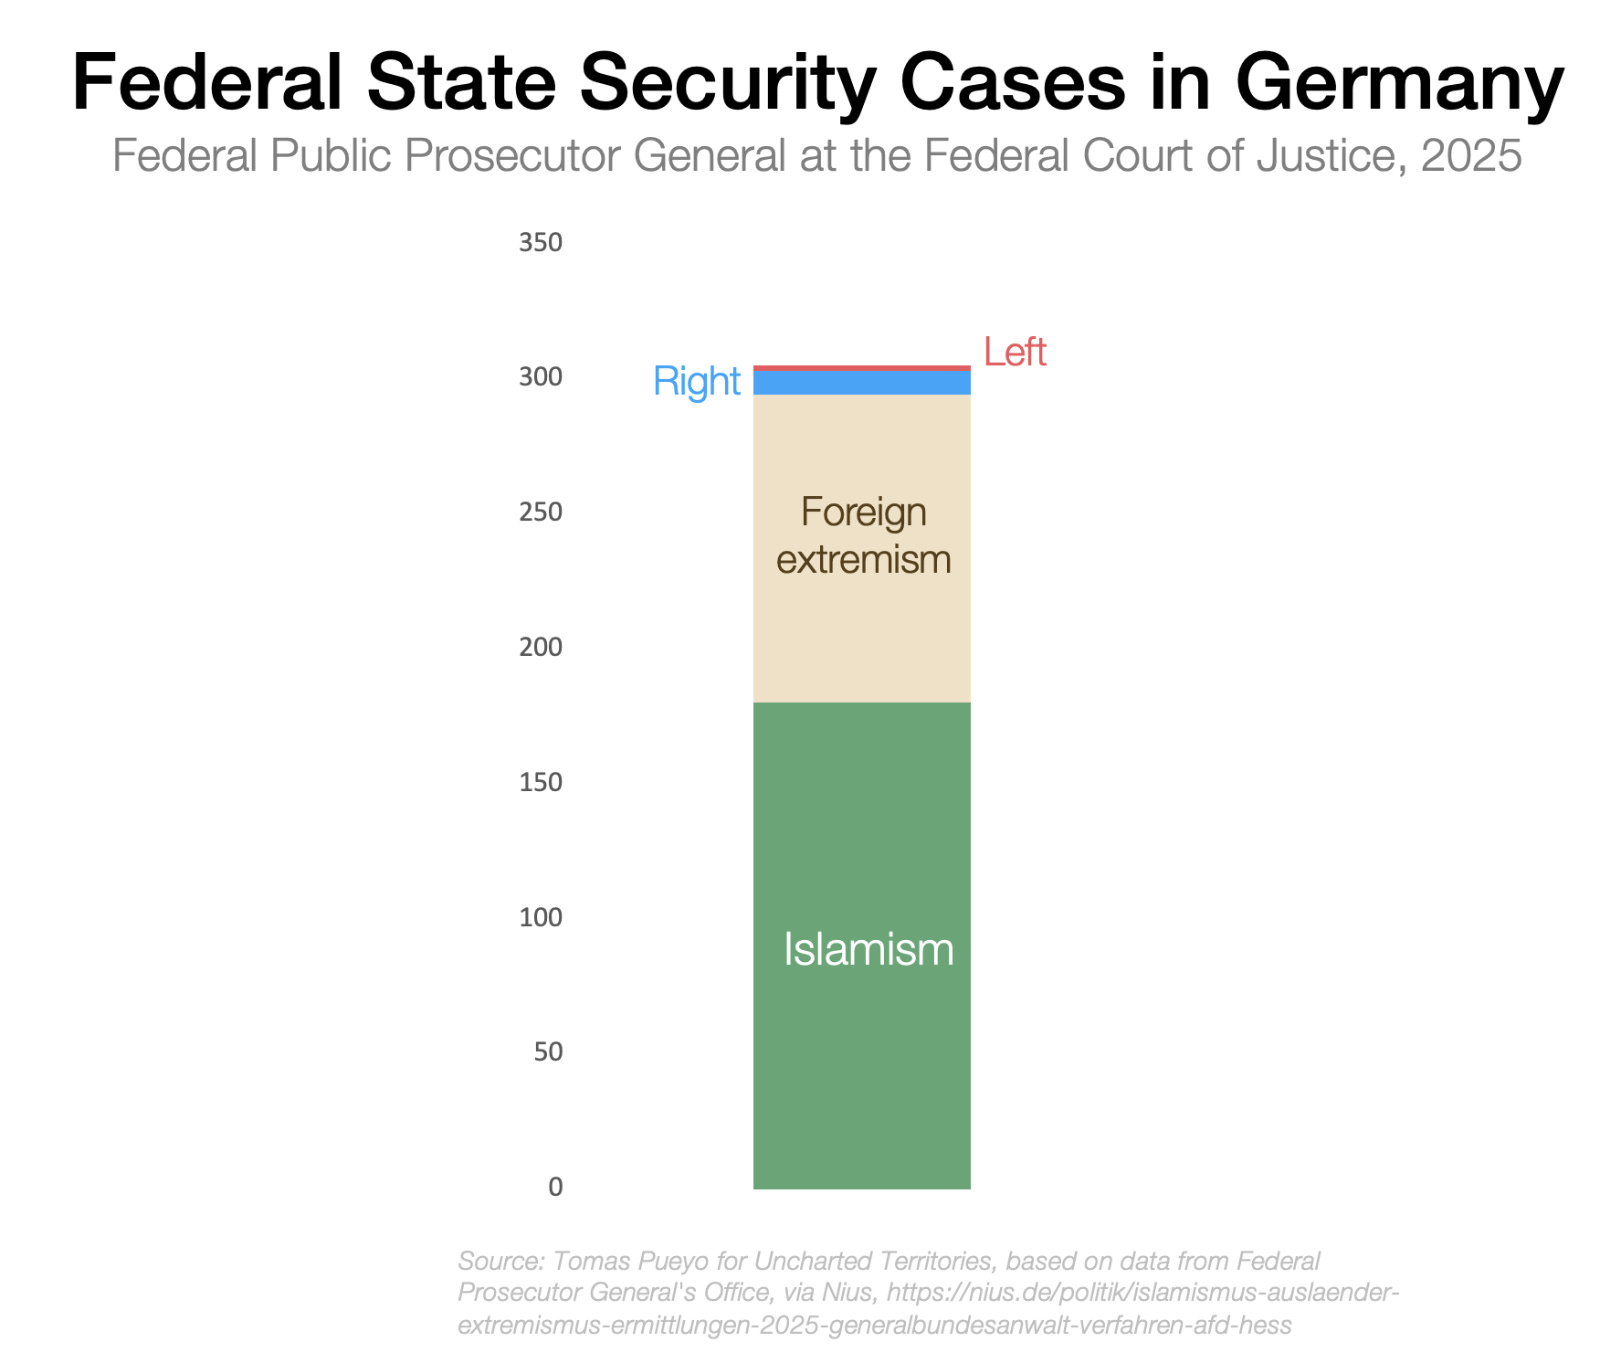
Here are security threat prosecutions in Germany in 2025.
In the UK, Islamism accounts for 67% of attacks since 2018, 75% of terrorism investigation cases, and 90% of convictions.
So I think we can all agree that the biggest threat in worldwide and European terrorism is Islamism, and it’s so stark that the 2nd most significant threat doesn’t even matter.
Social Cohesion
Several papers have found that ethnic diversity reduces neighborhood trust and social capital, including this meta-analysis, although the linchpin might not be diversity alone, but also segregation: If a certain ethnicity is concentrated in a small area, neighborhood trust and social capital will shrink.
Looking specifically at Muslims, this paper found that 2nd generation Muslim immigrants had lower trust than their non-Muslim counterparts, and that this was due to cultural transmission rather than discrimination or exclusion.
This graph looked not at the crime, but the feeling of safety in different communes in Denmark. It then compared it to the share of people of MENAPT (Middle East, North Africa, Pakistan, Turkey) origin.
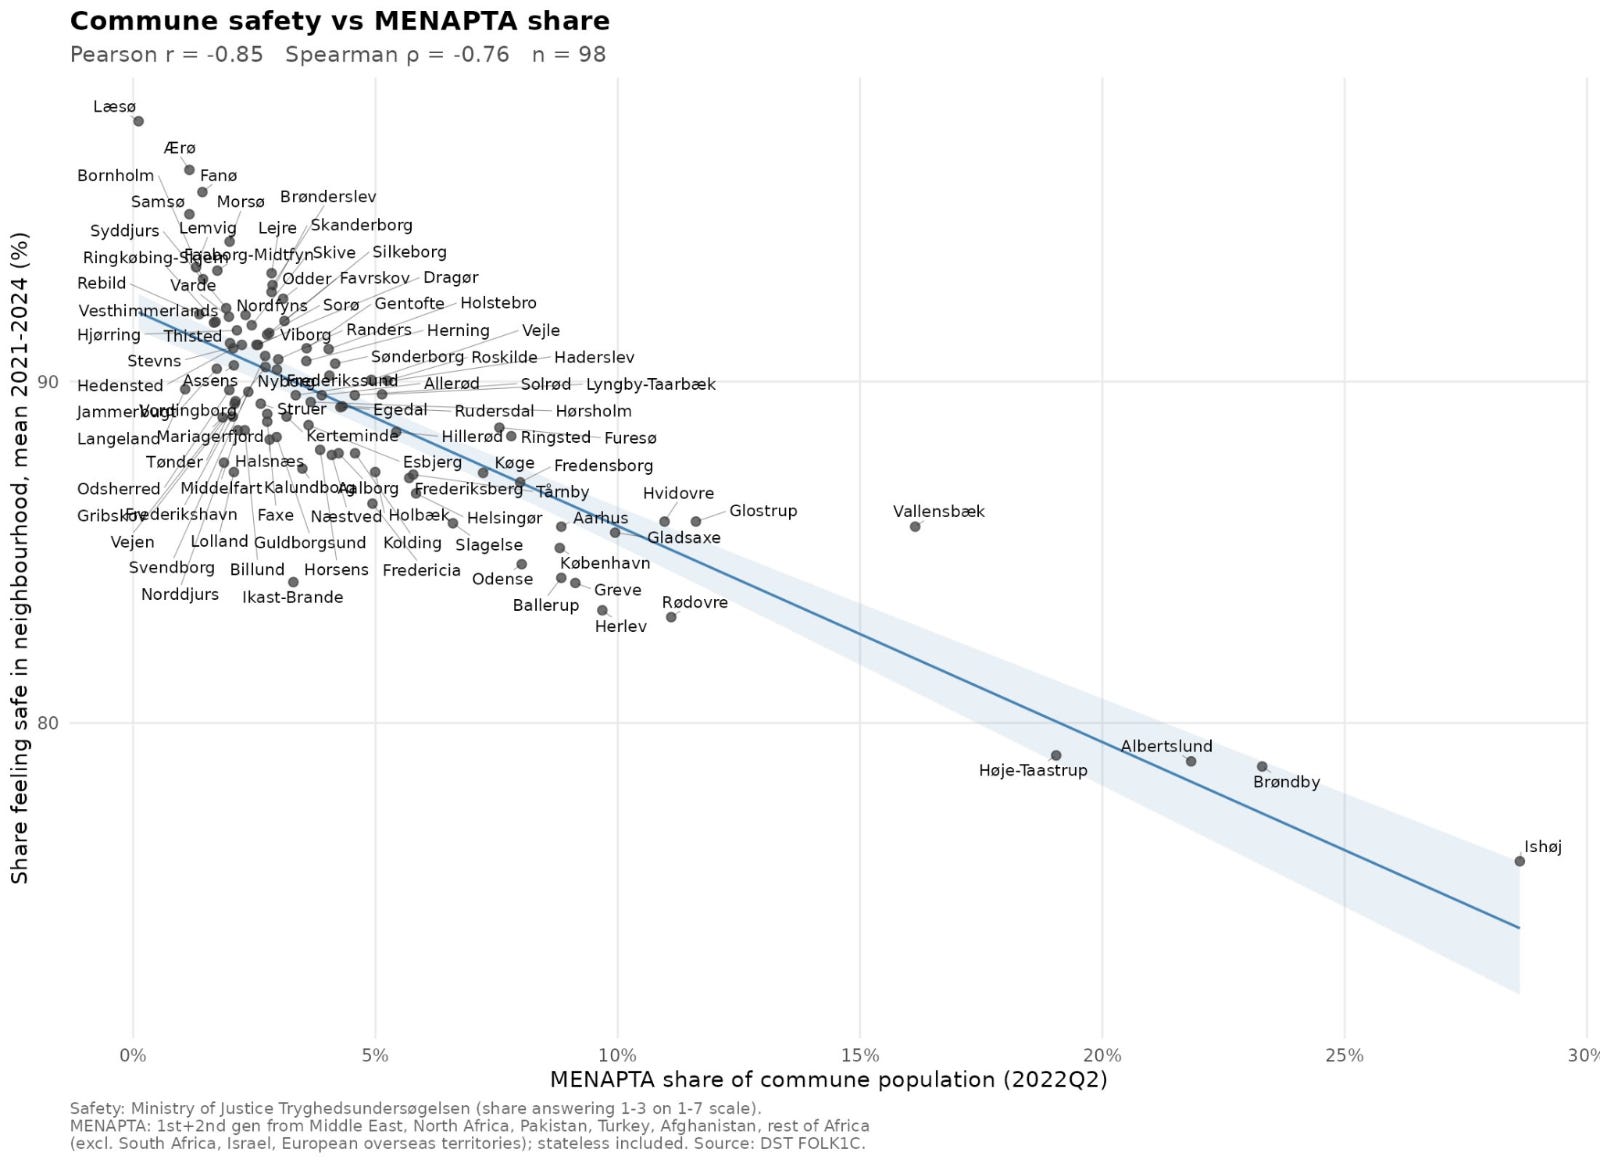
There’s a real cost in social cohesion that is paid by immigration, whether that is due to Muslim immigration or that of others. In Europe, however, it’s more acute with Muslims.
Alright, let’s move to economics.
2. The Economics
Employment
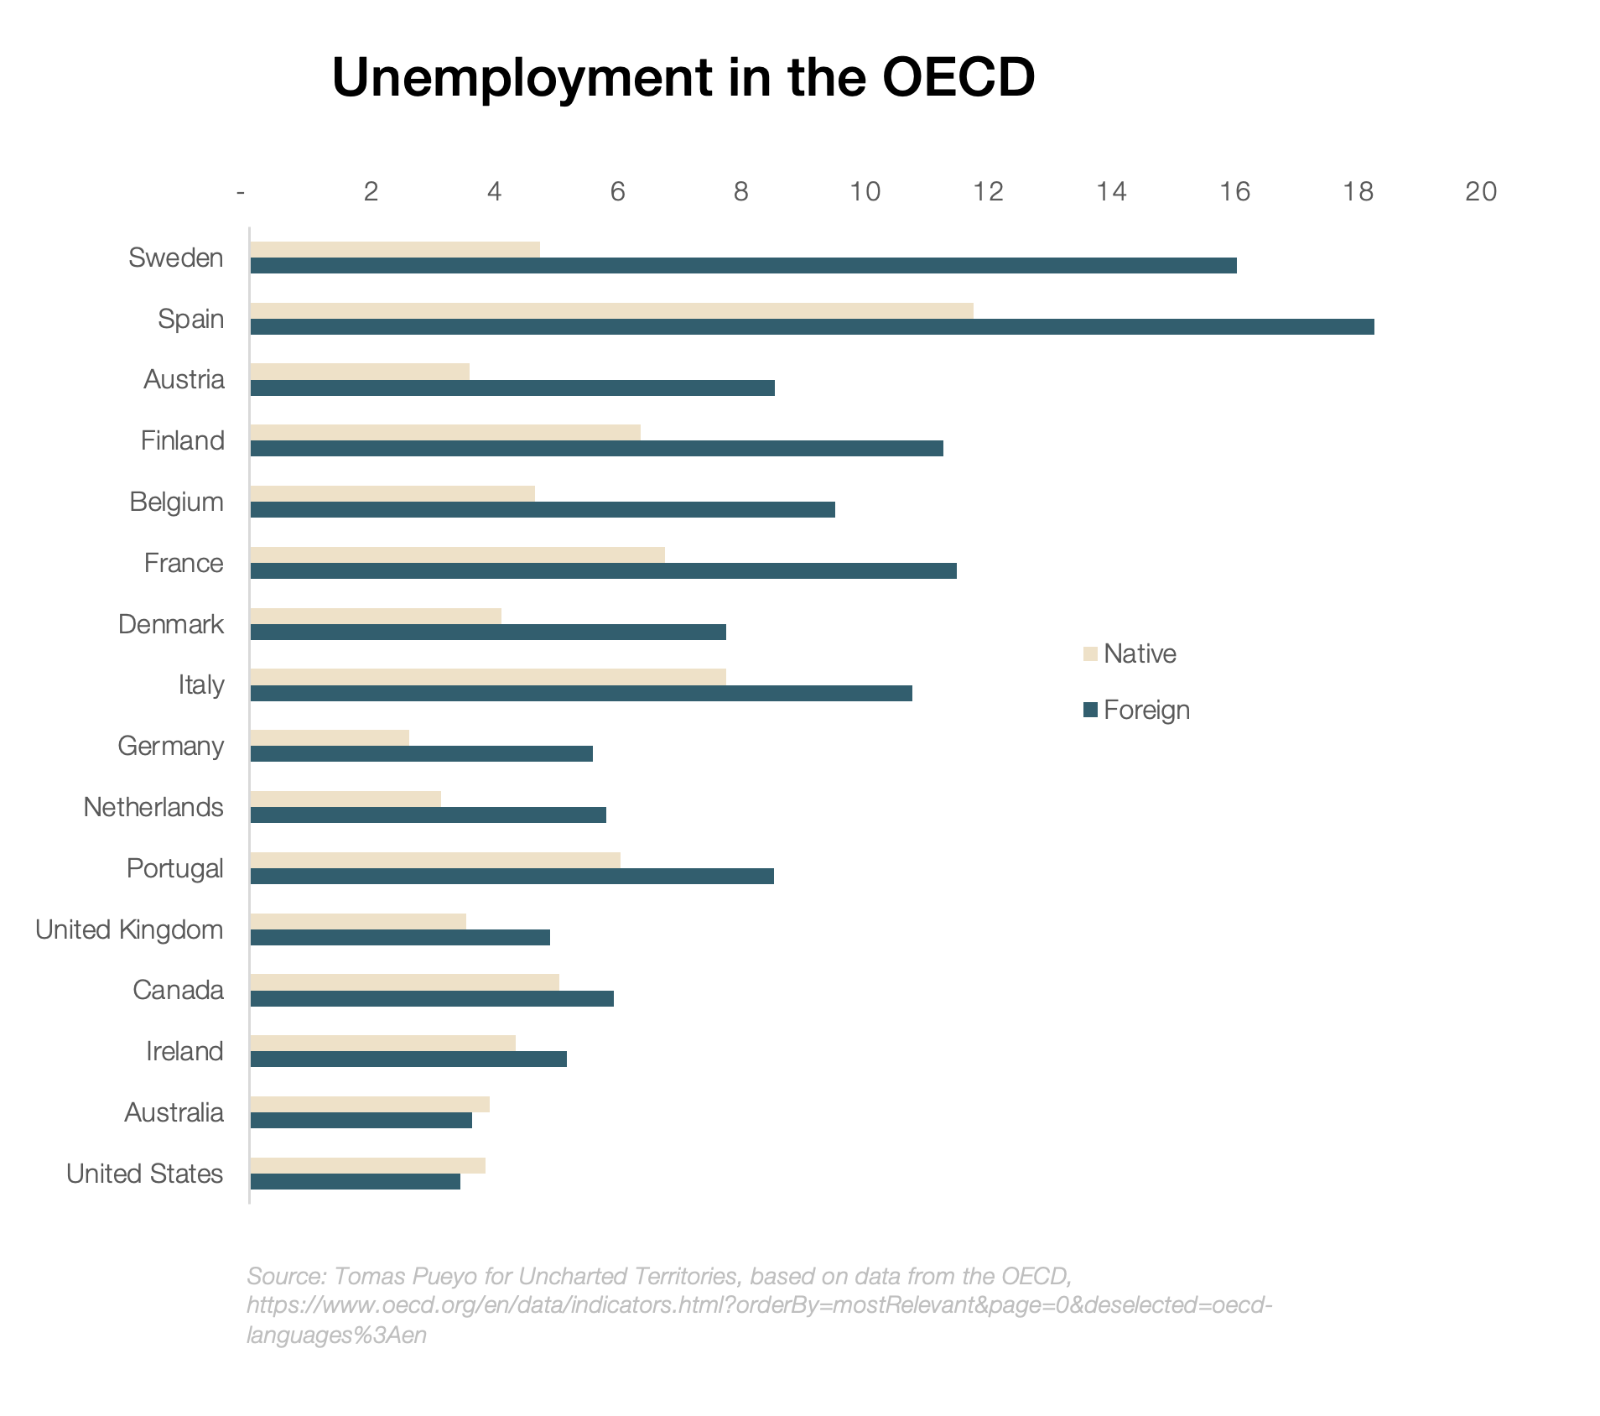
Some Anglosphere countries manage to get immigrants to work more than natives, but that’s not the norm. In most countries, their unemployment is higher—in Sweden, foreign unemployment is an astonishing 2.5x the native level!
This immigration has many different origins, but when we zoom in to Muslims, the data holds (here, employment rate rather than unemployment rate).
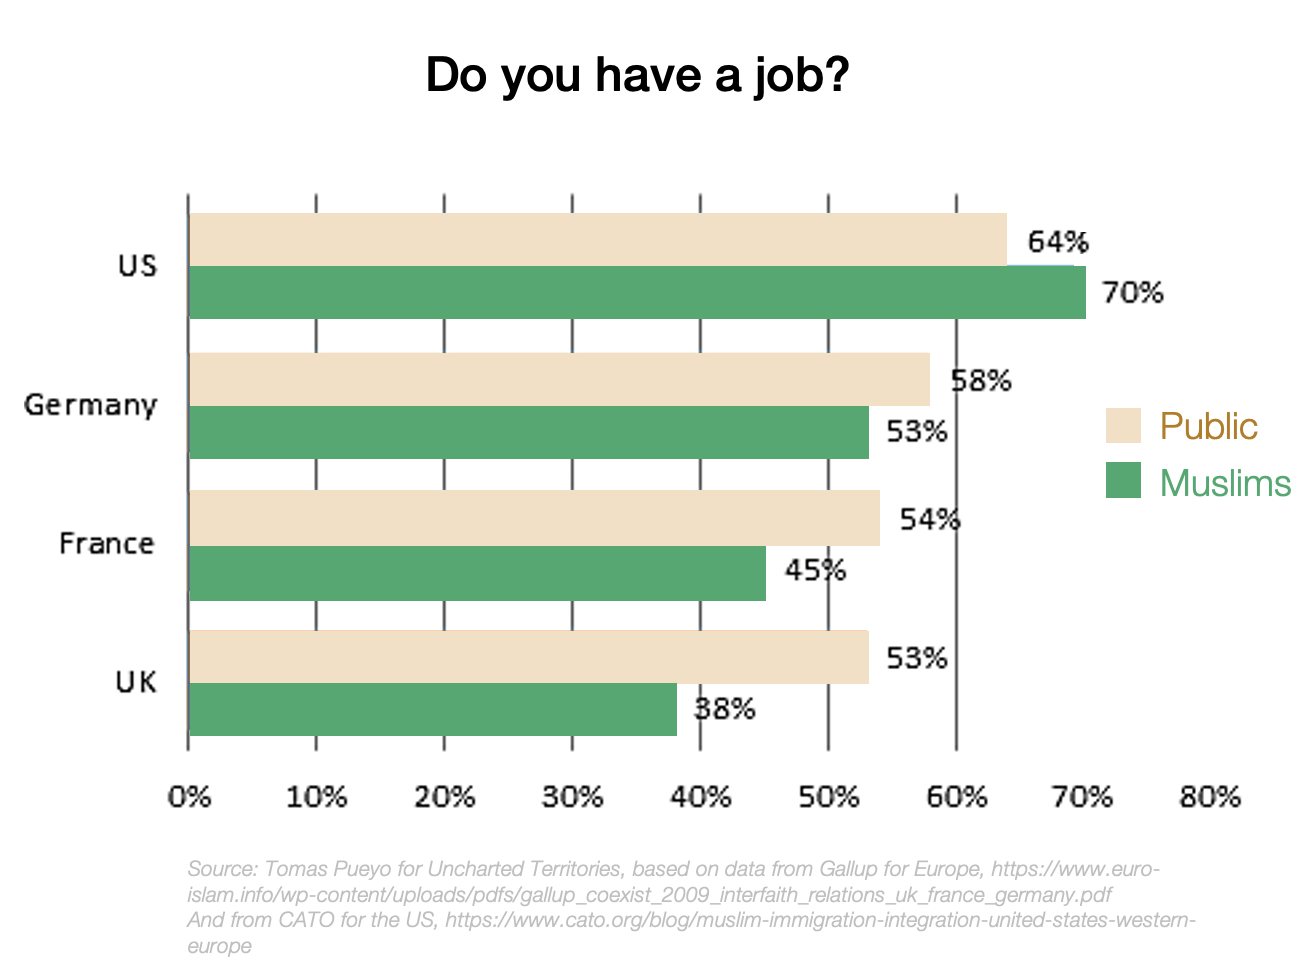
One reason for these differences is regulatory. The US makes it easy for foreigners to start working immediately—they even penalize them if they don’t. Others make it very hard, and might even support not working by giving welfare—in some cases, at higher levels than to locals. This is important in the short term, but also the very long term, because the first months after arrival are crucial. If you establish yourself in a system where you have to work and you must meet and socialize with locals to do so, you’re more likely to be integrated and continue working. But if you can’t work, you’ll stay more with family and other compatriots, and you’ll get used to a lifestyle where you don’t have to work.
Another reason might be education. US Muslims are more educated than the average American.
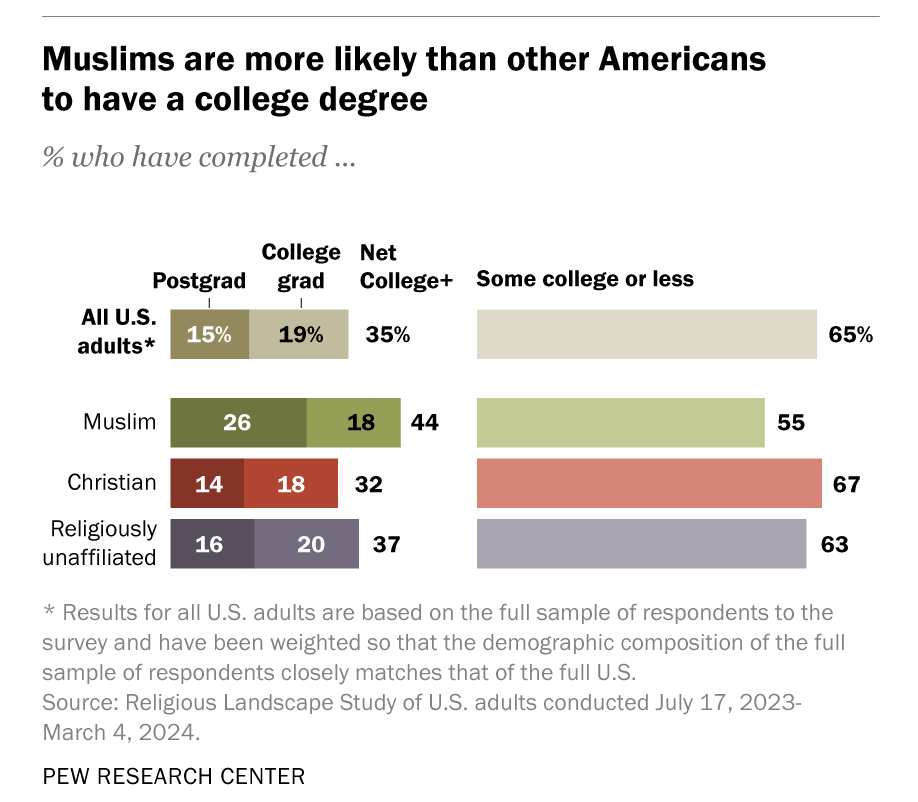
In part, this is because the US attracts high-education Muslim immigrants.
So that’s the destination effect. But the origin effect also matters.
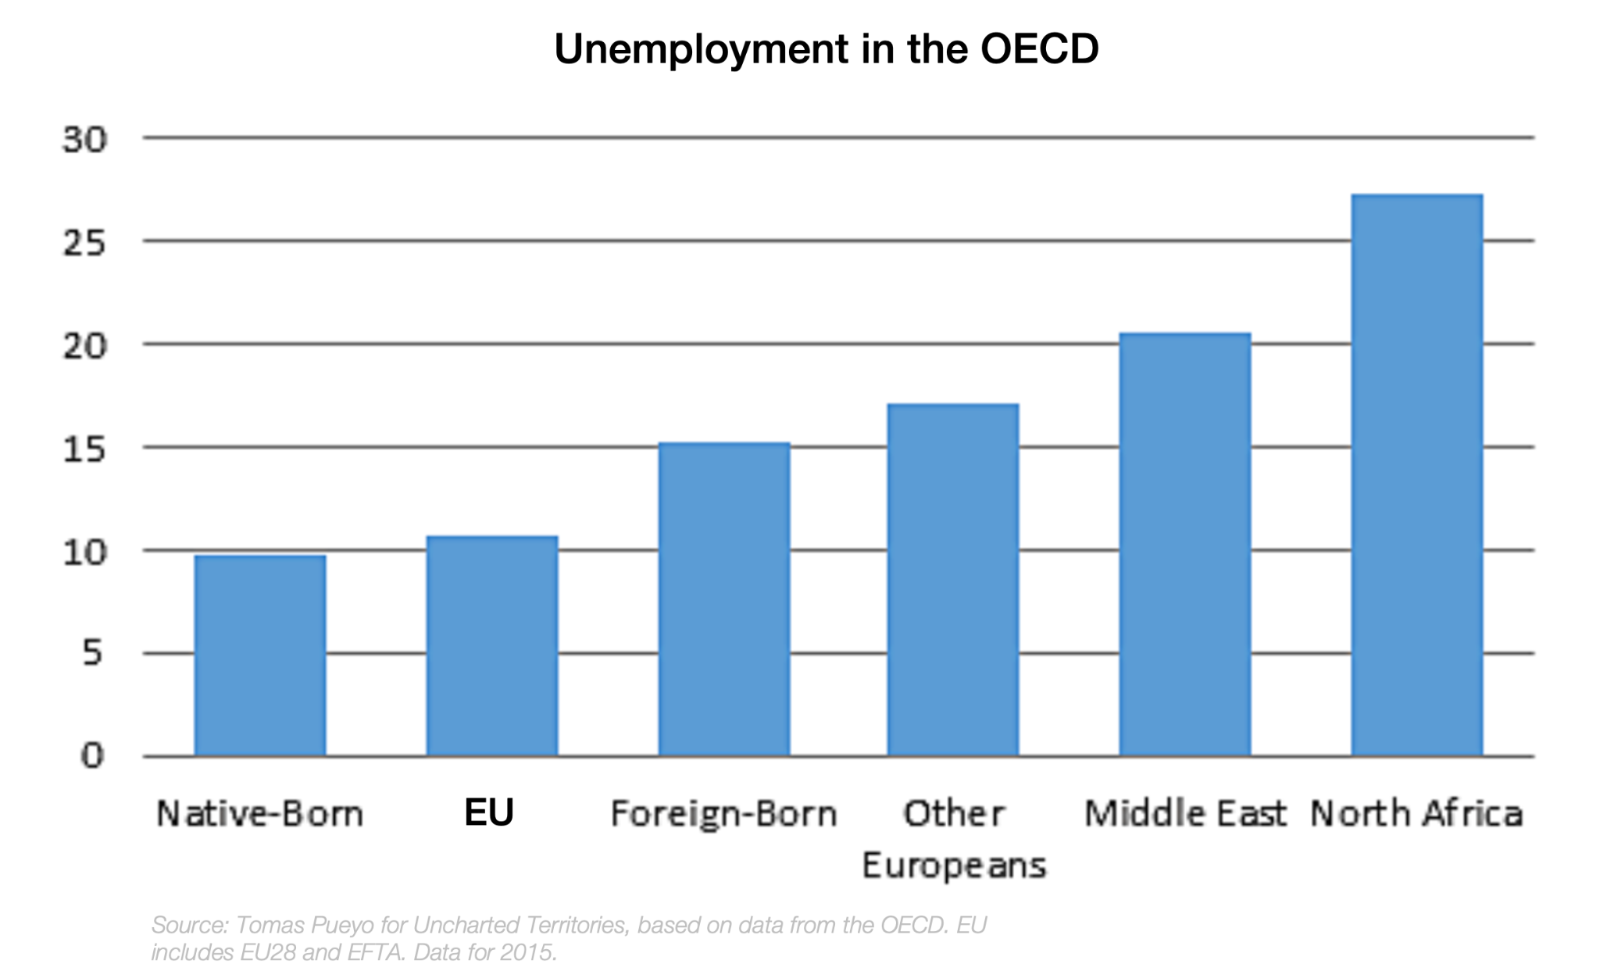
We see similar data whenever we zoom in to specific countries.
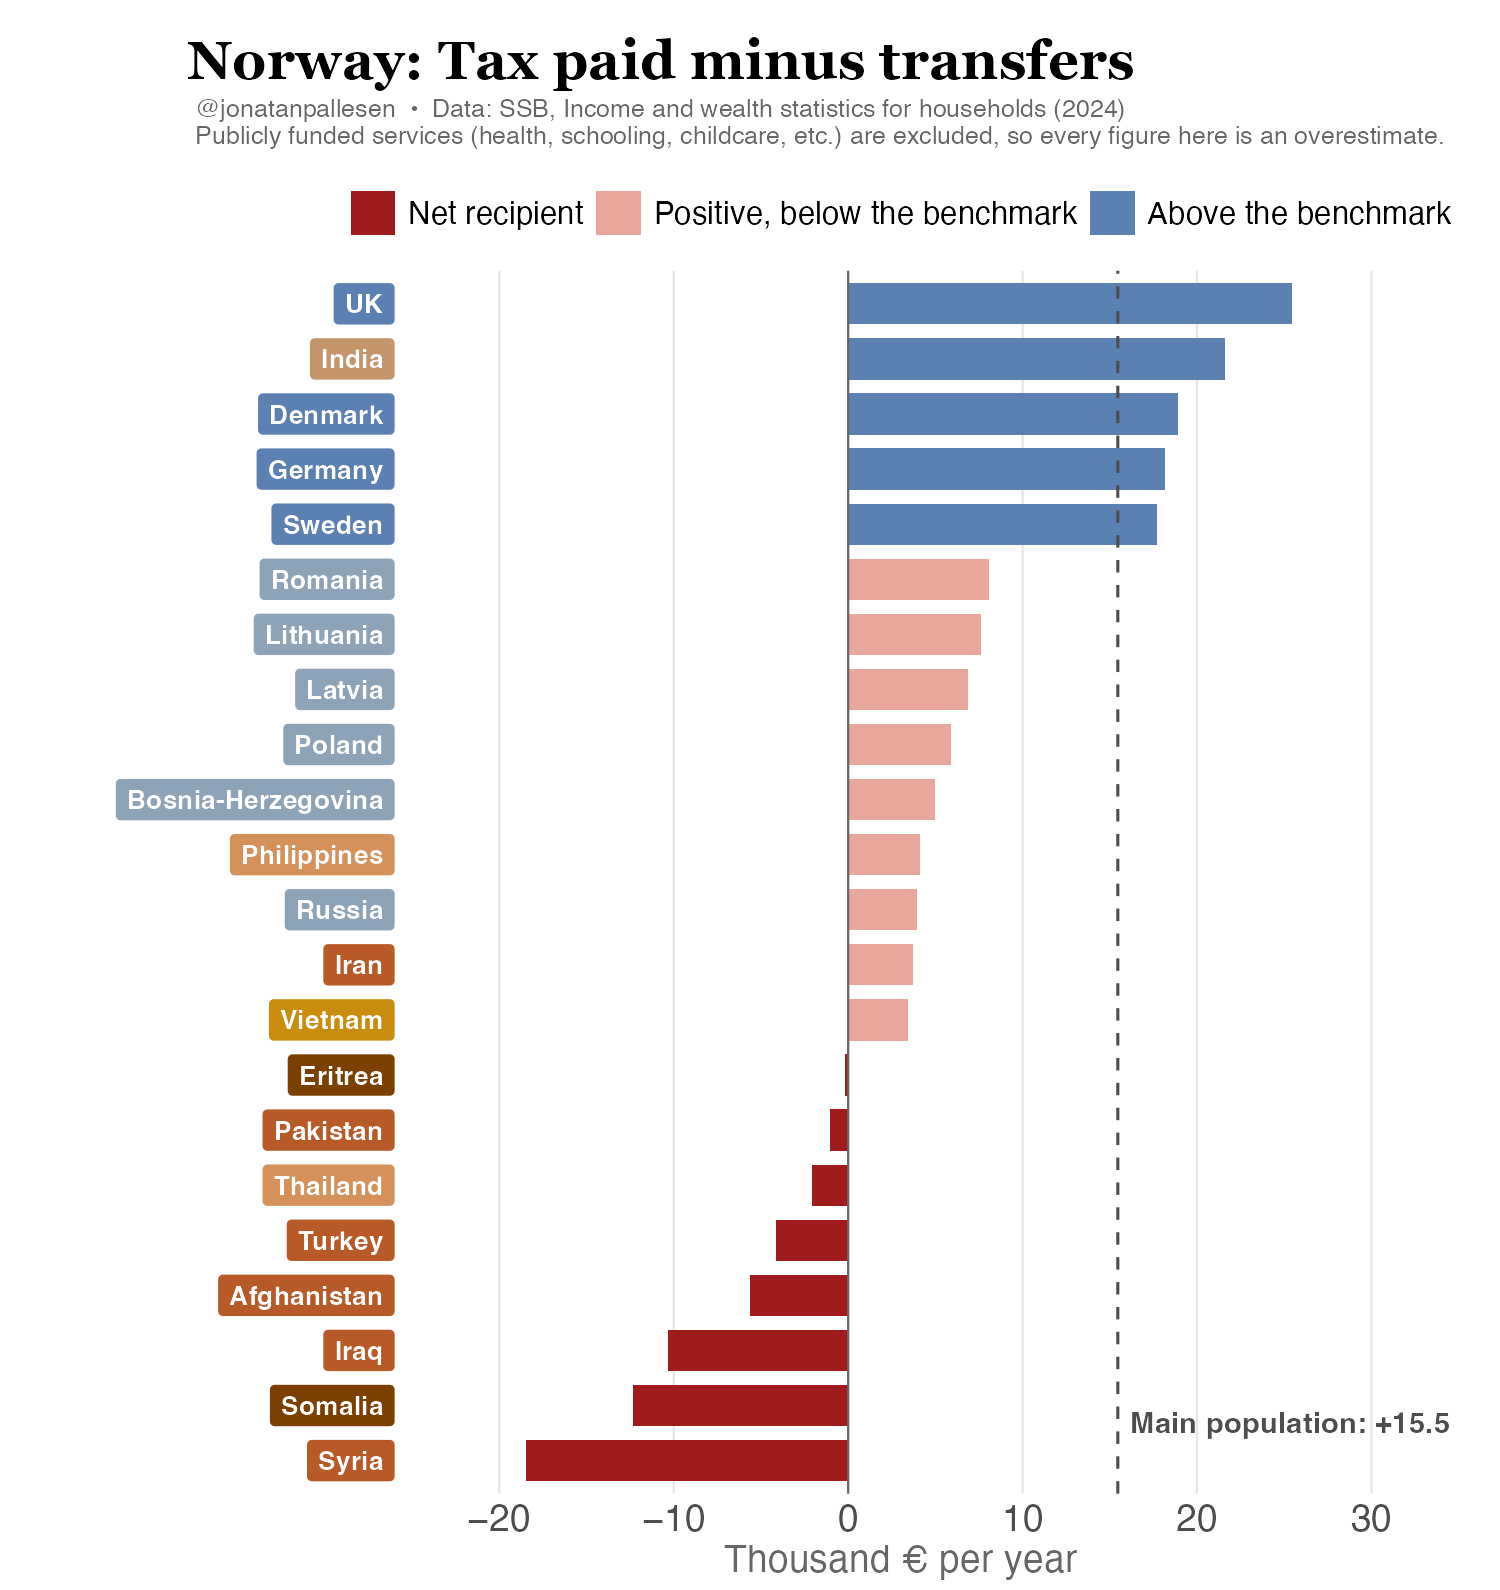
Norway
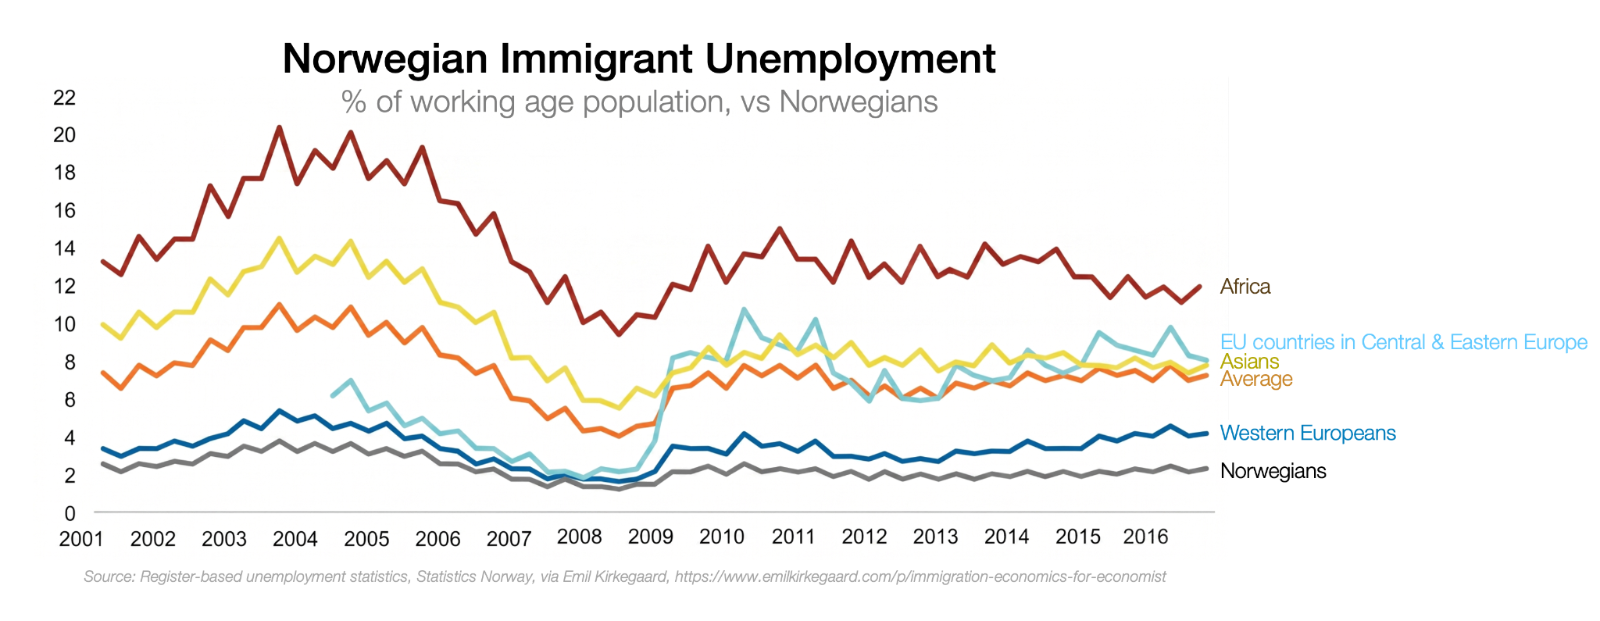
Update July 20 2026: Here’s data from Norway. You won’t believe the results.
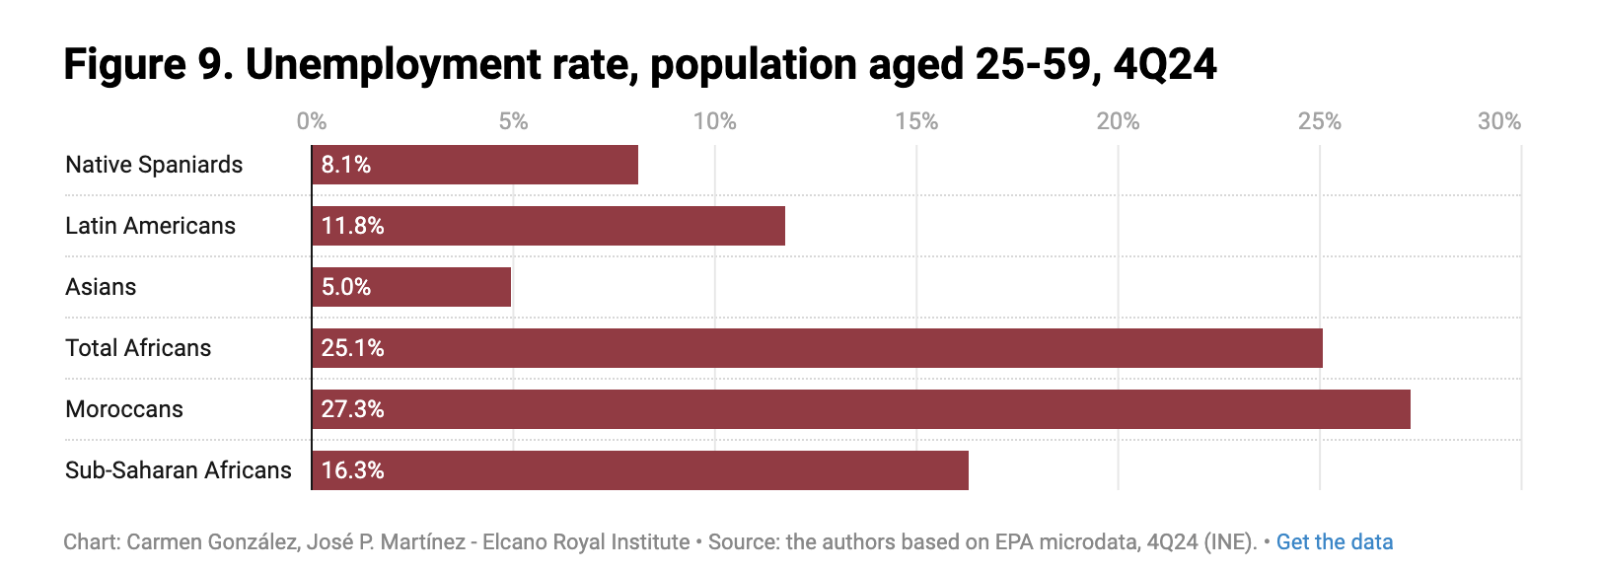
We can see a breakdown of the problem from some data from Spain.
Spain
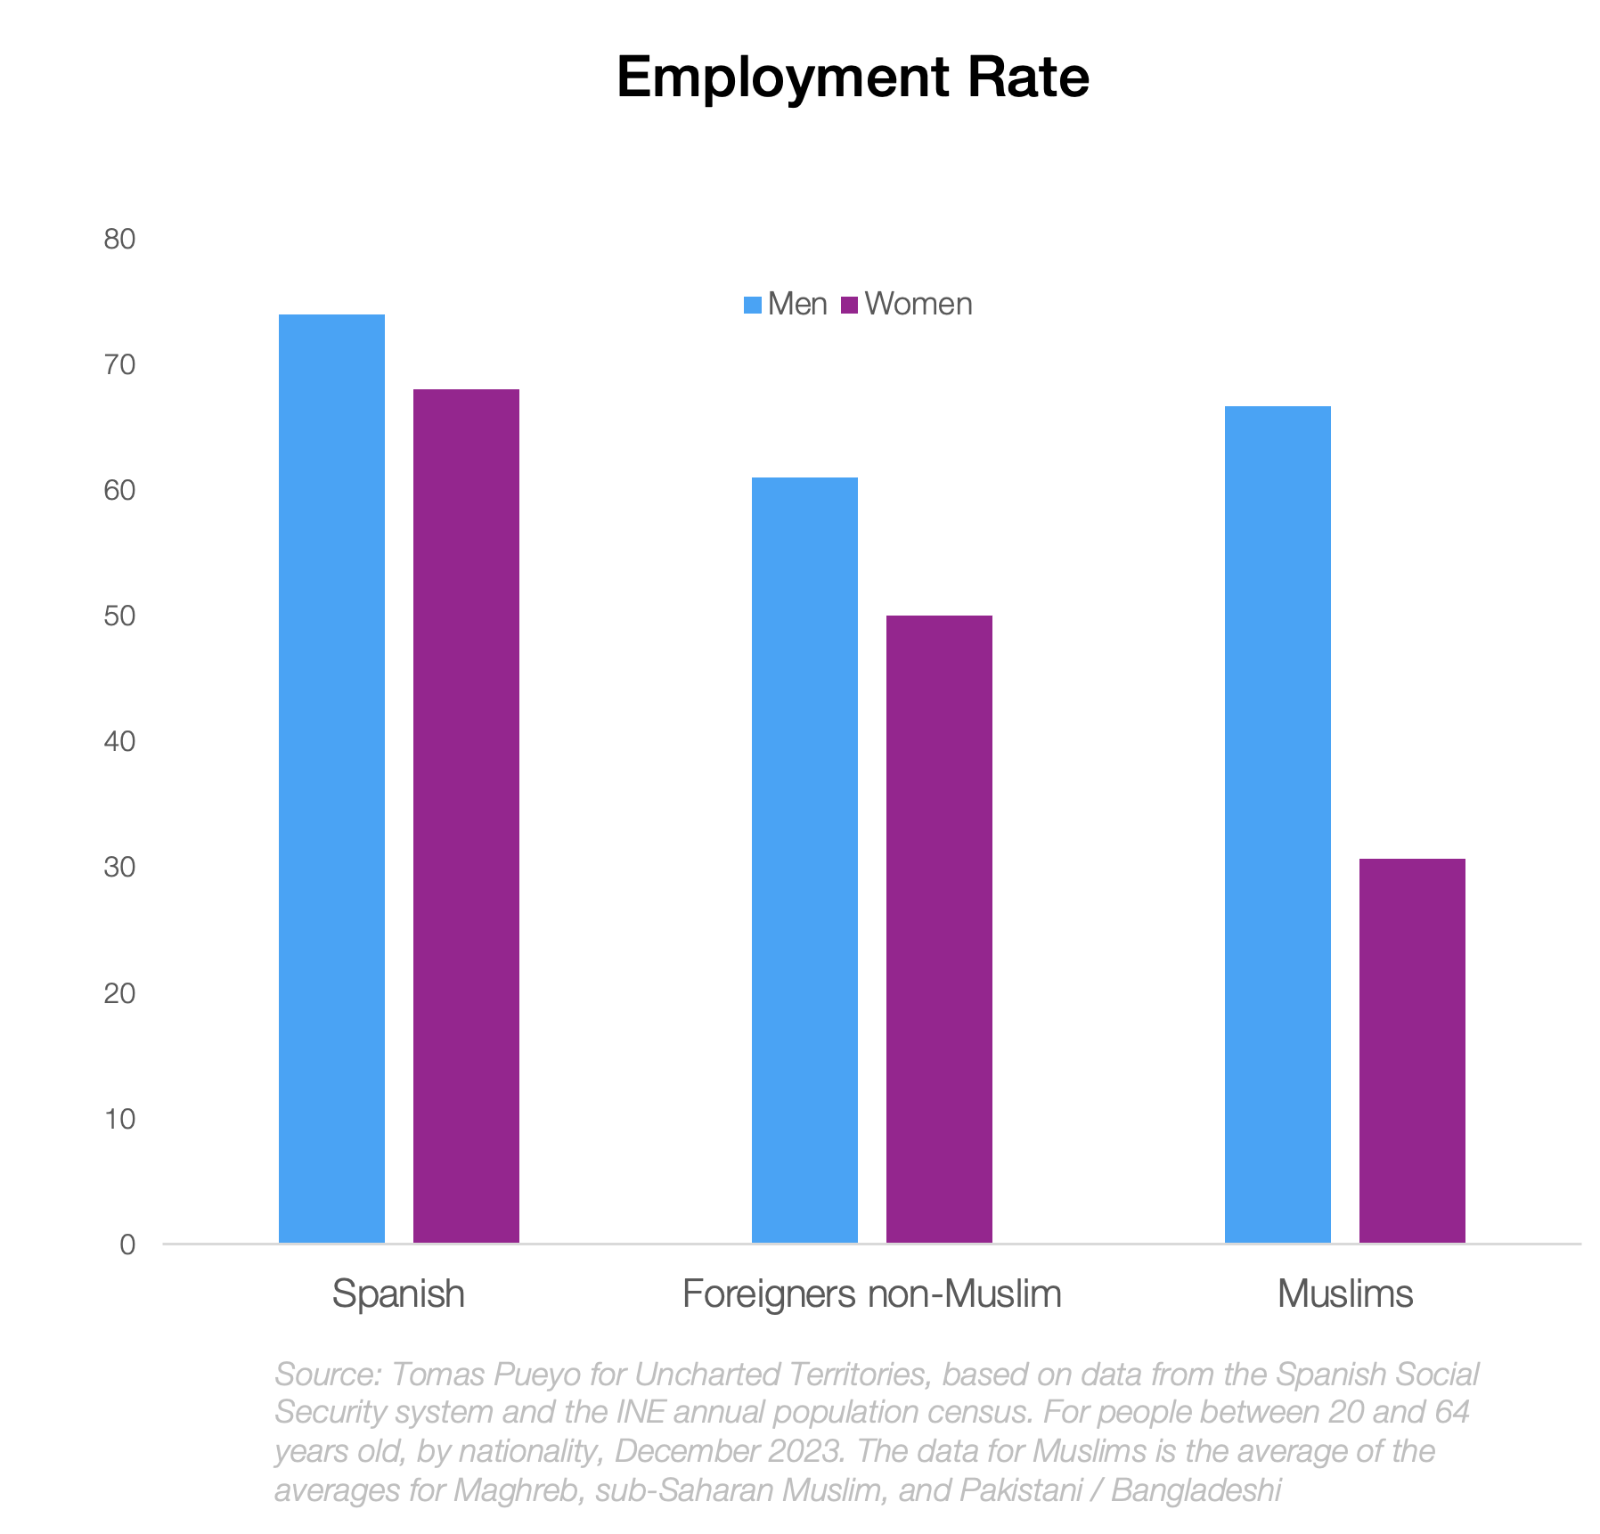
In Spain, where the vast majority of African immigrants are Muslim, their employment rate is substantially lower than that of locals or Latin American immigrants.
This is driven basically by the fact that Muslim women generally stay at home
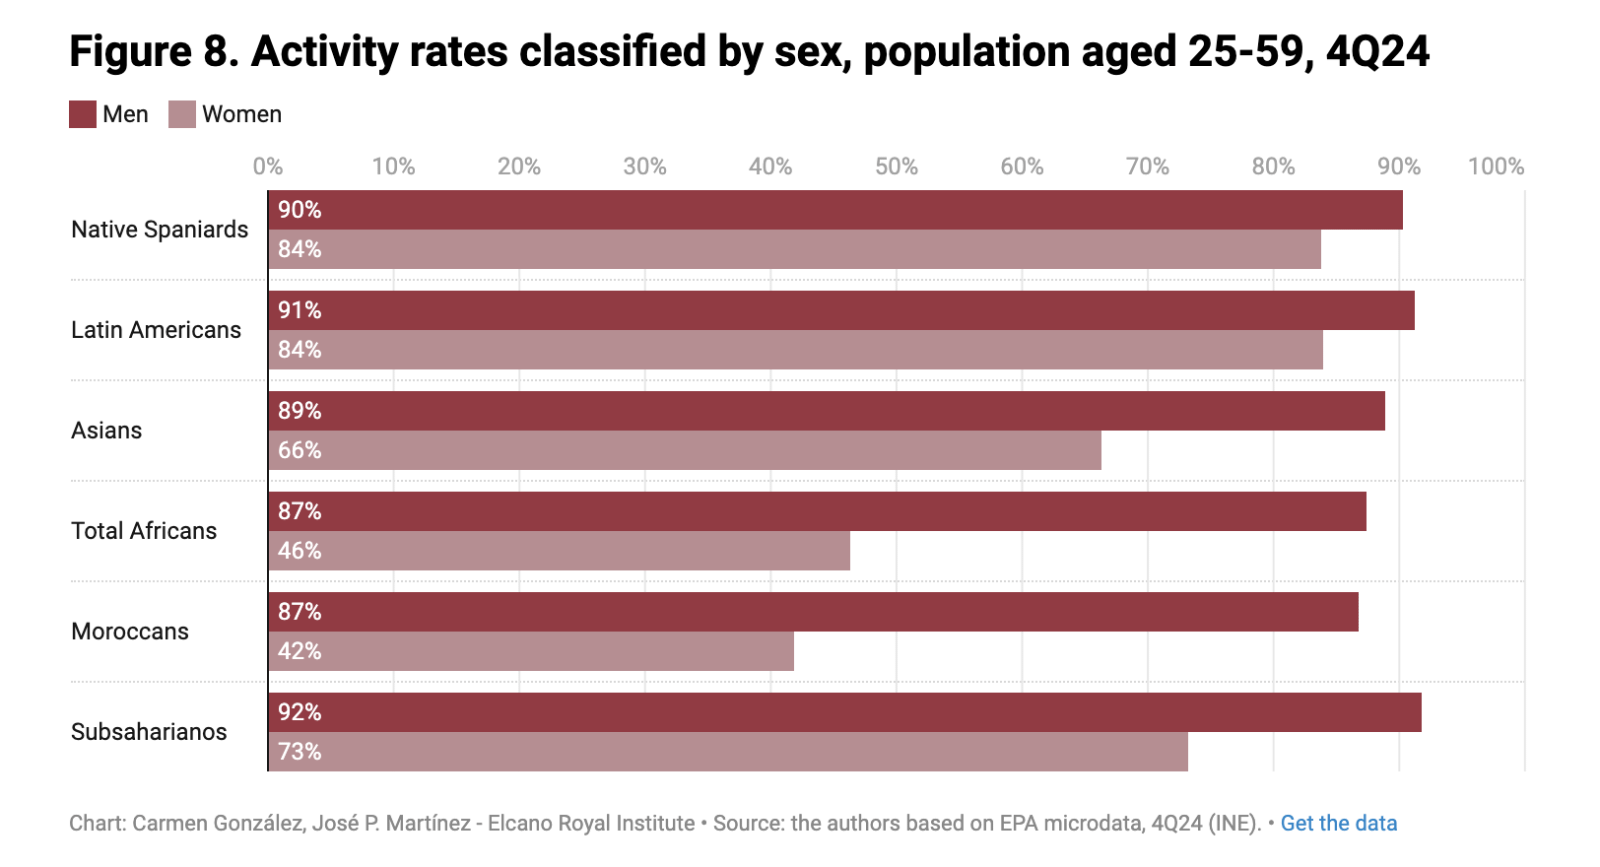
This is the activity rate, which counts those with a job or looking for one. What if we look at actual work rates?
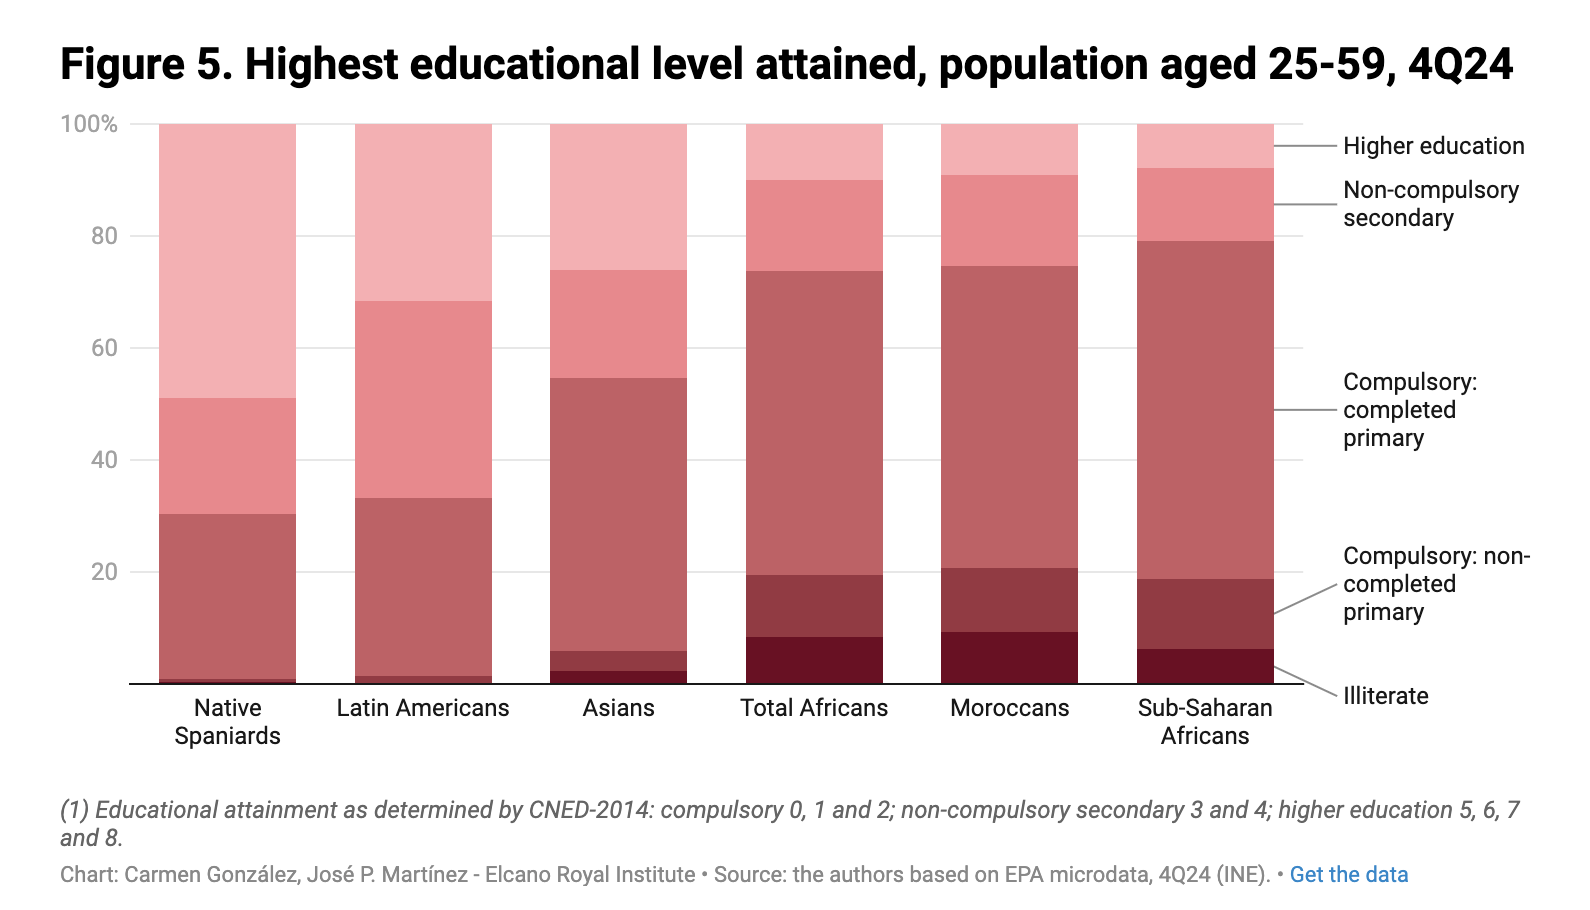
The type of work also matters. The education rate of MENA (Middle East and North Africa) immigrants in Spain is substantially lower than that of locals or other immigrants.
UK
In the UK, Muslims are 2.2x less employed than the average of the population.
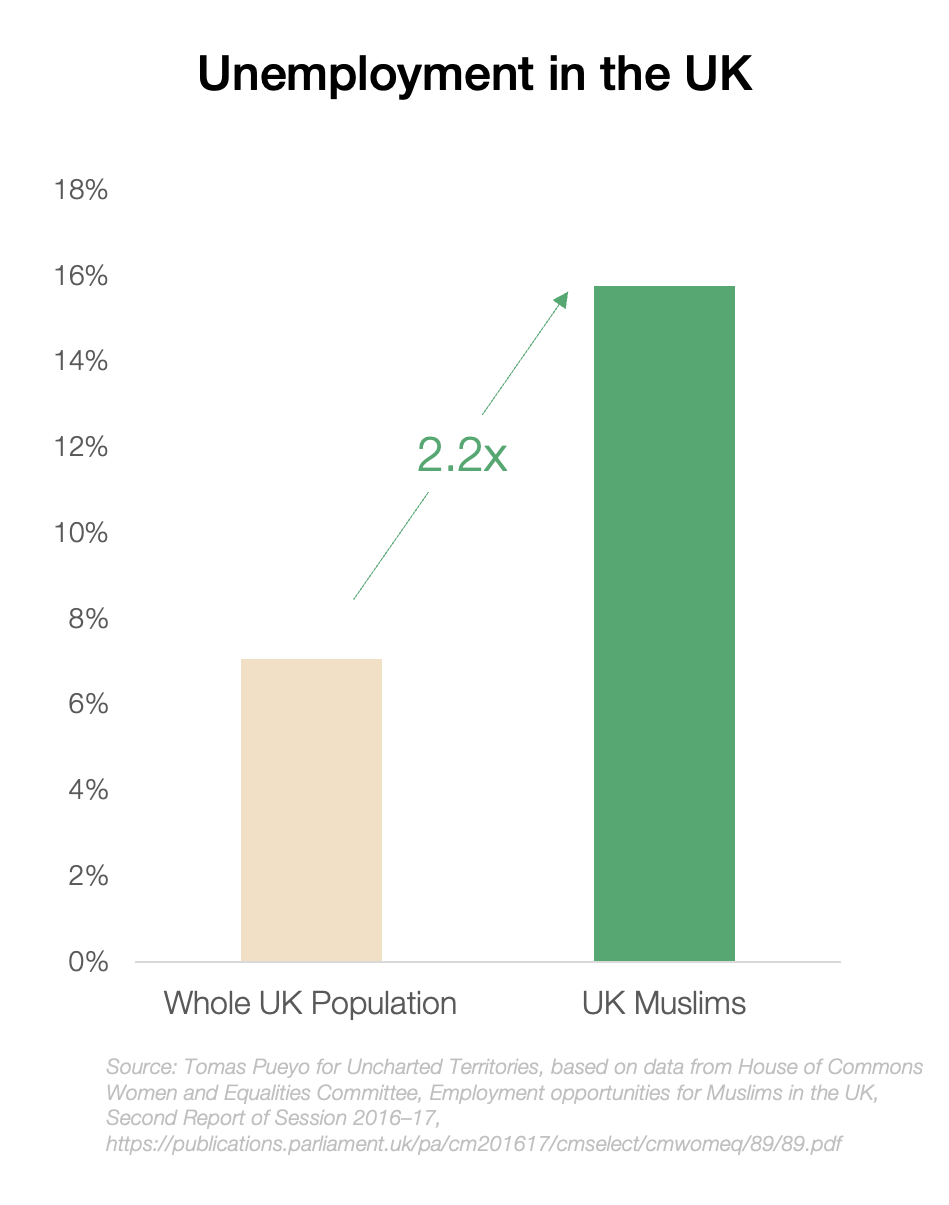
And unemployed actually hides the true impact, because many who don’t work don’t appear in these statistics, if they’re not actively looking for a job.
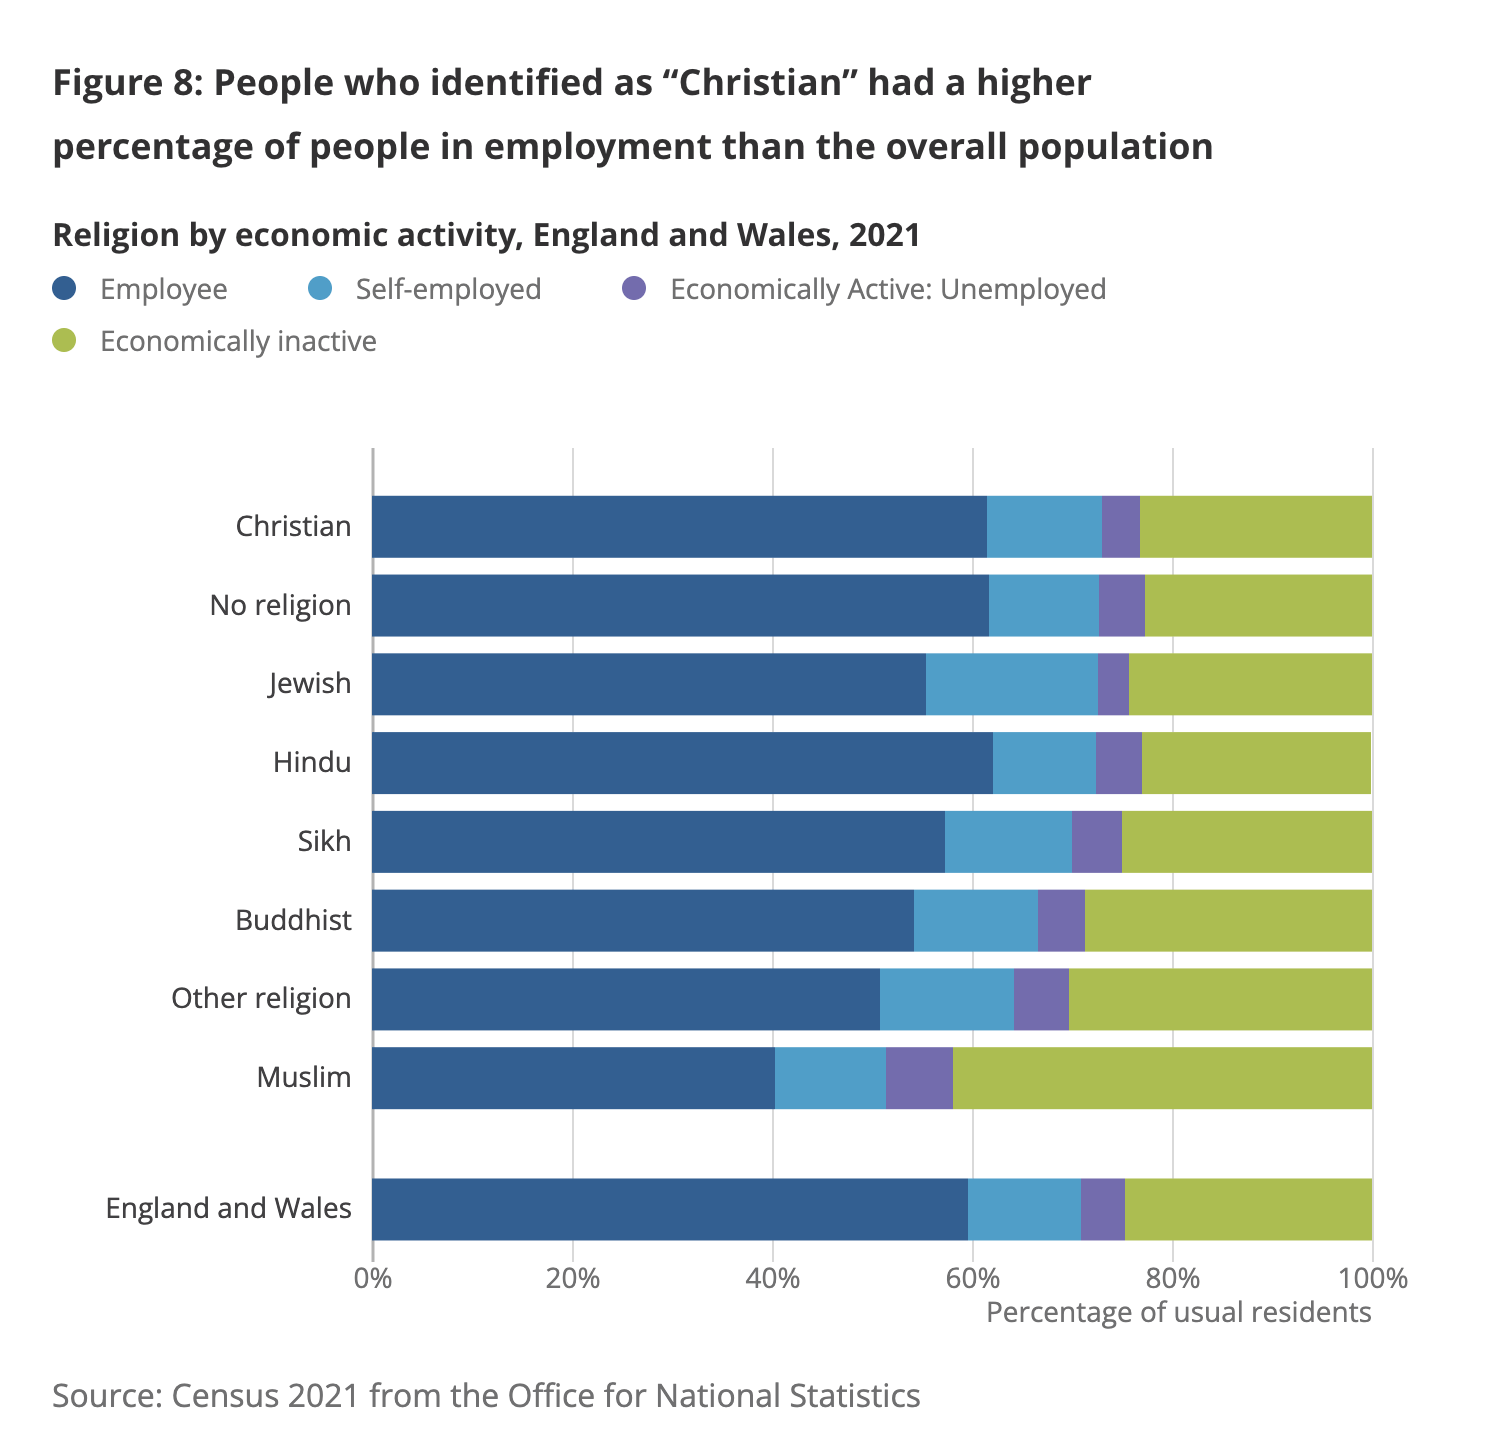
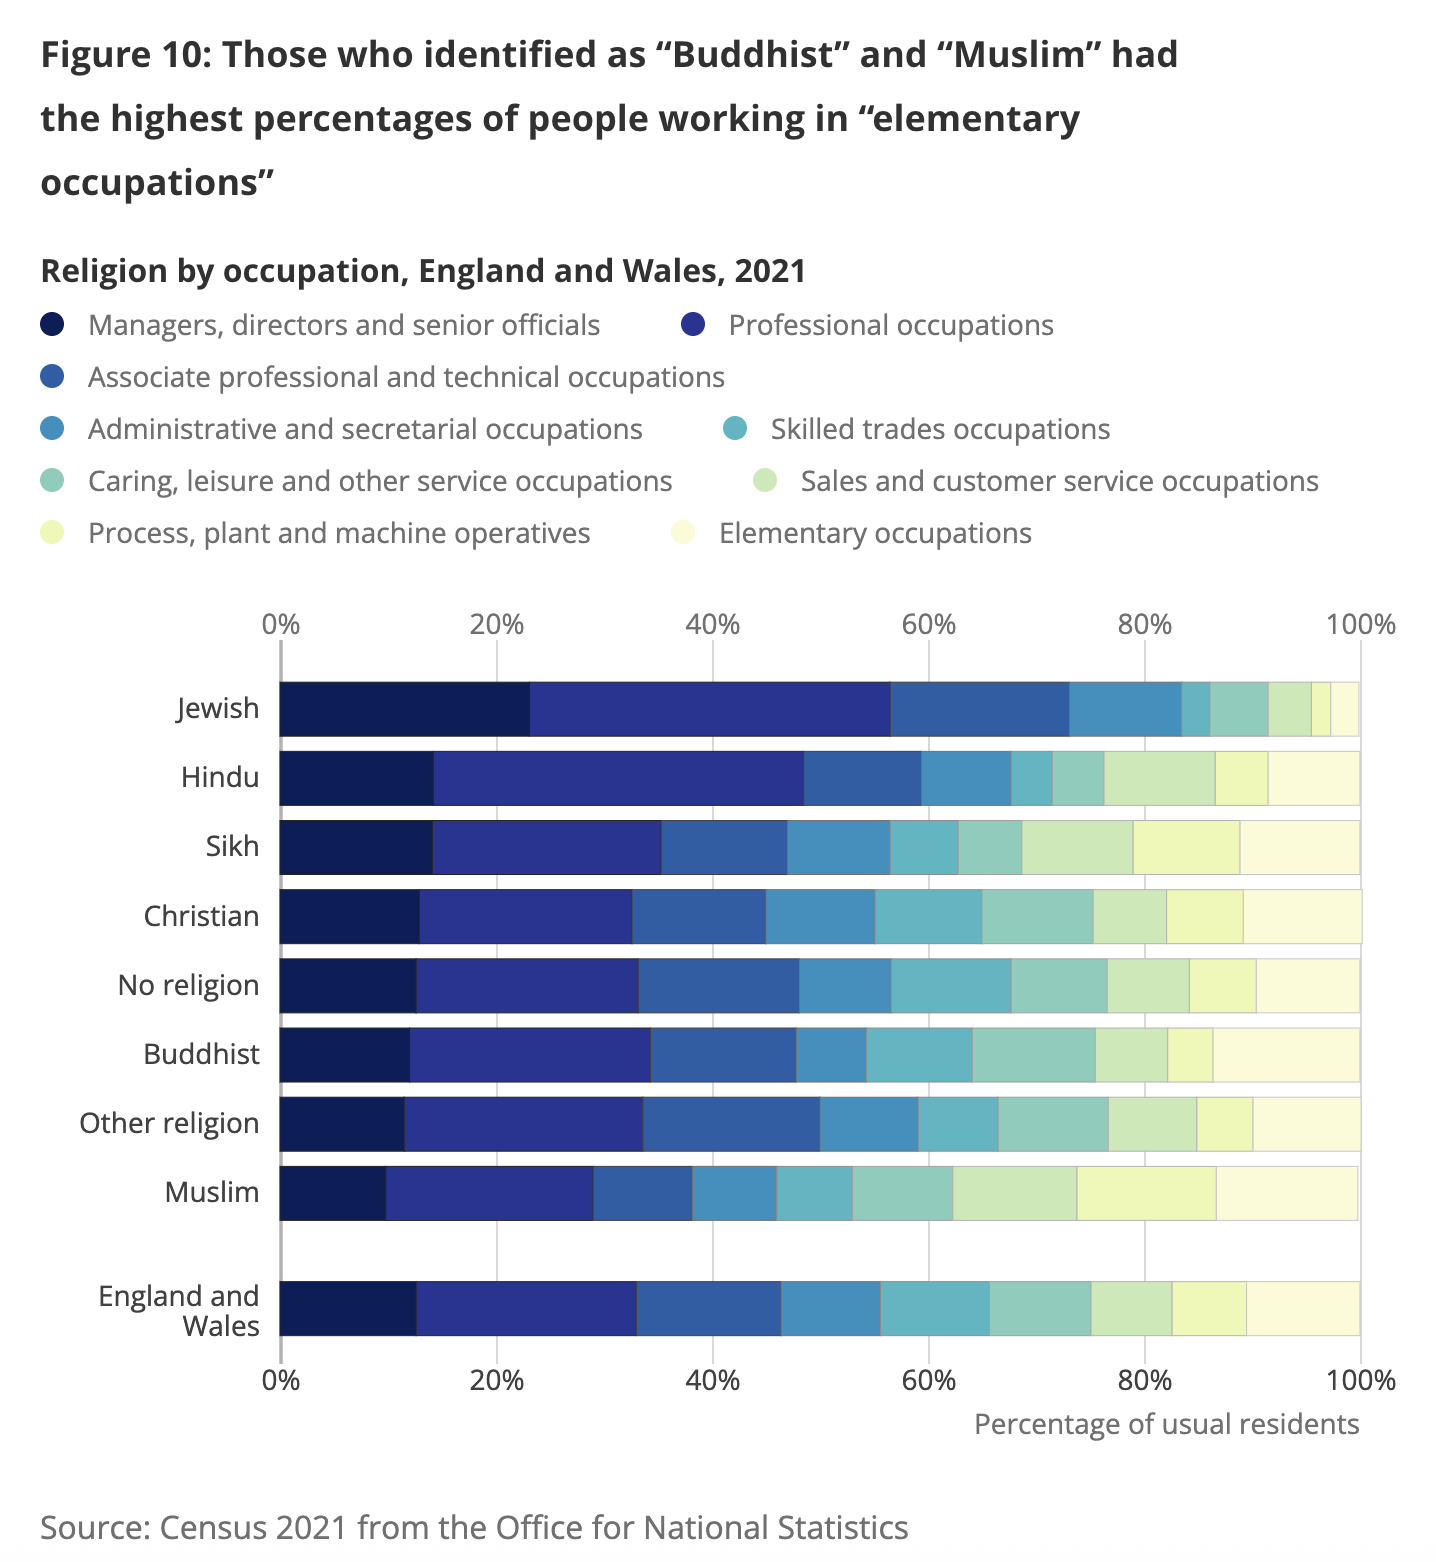
Muslims also tend to have lower-paying jobs:
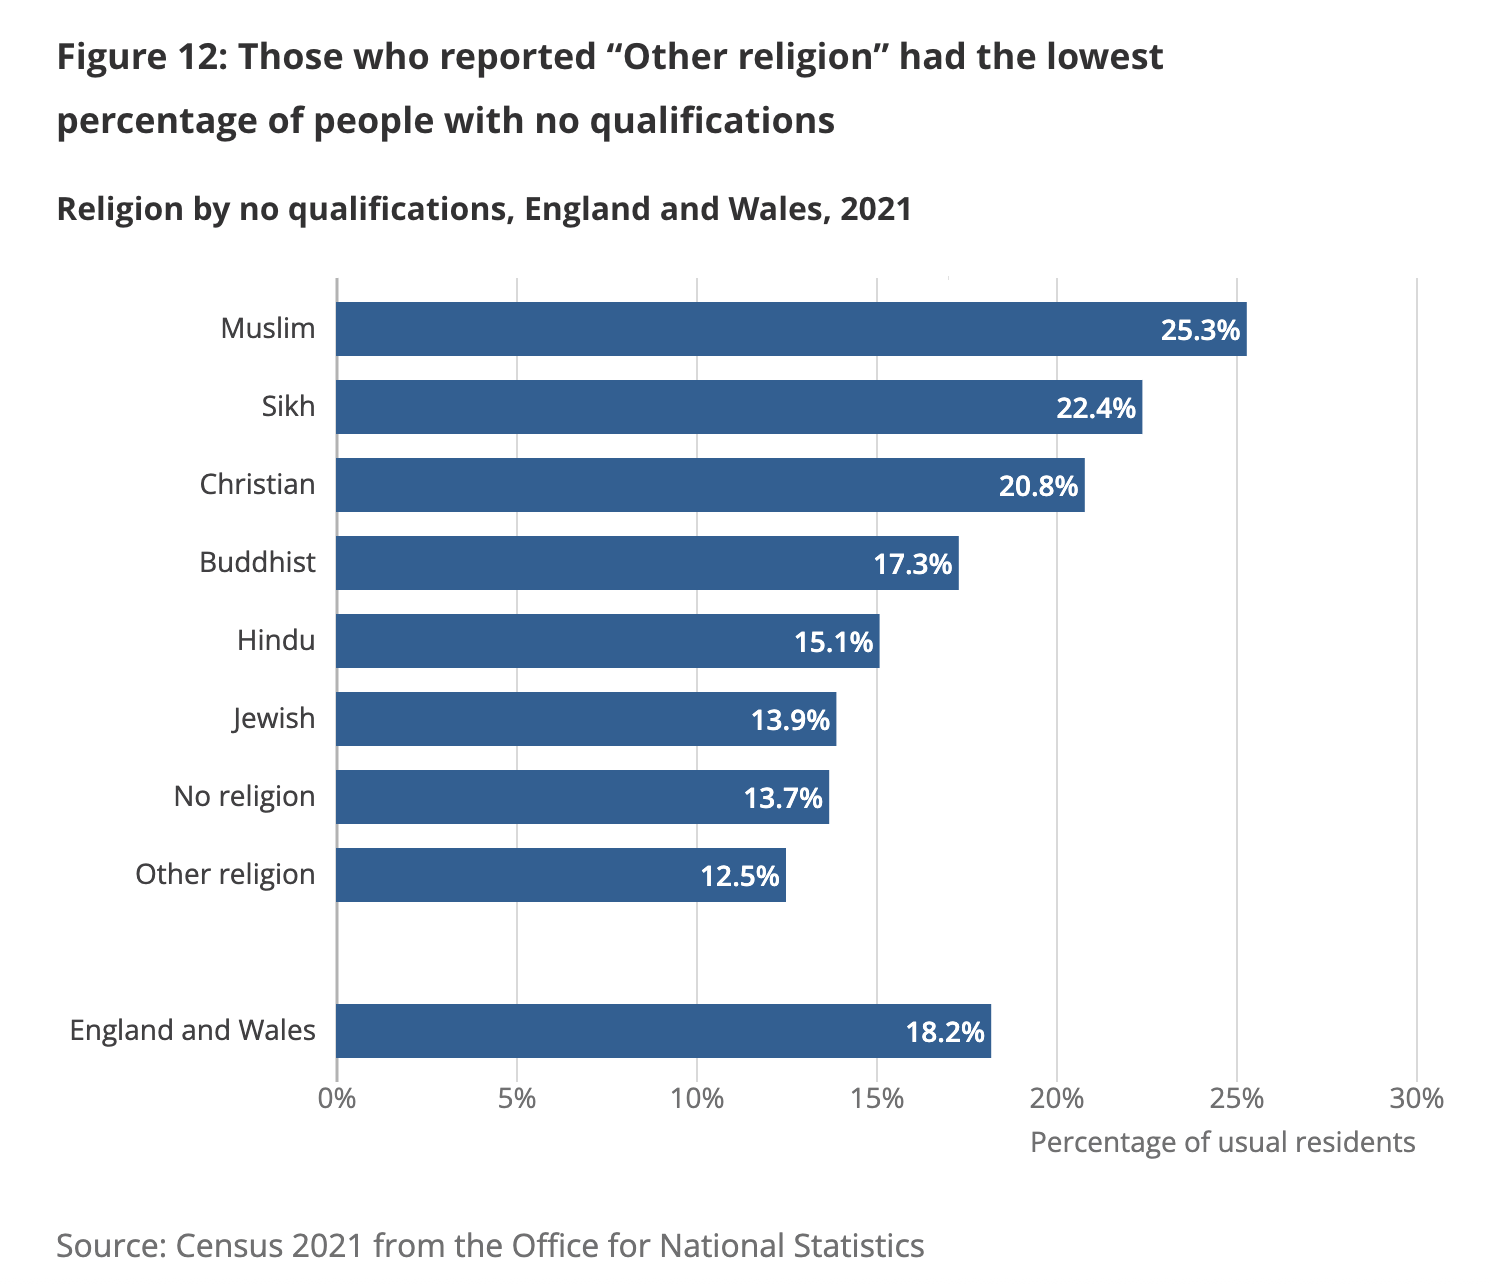
Among other reasons, because they have less education:
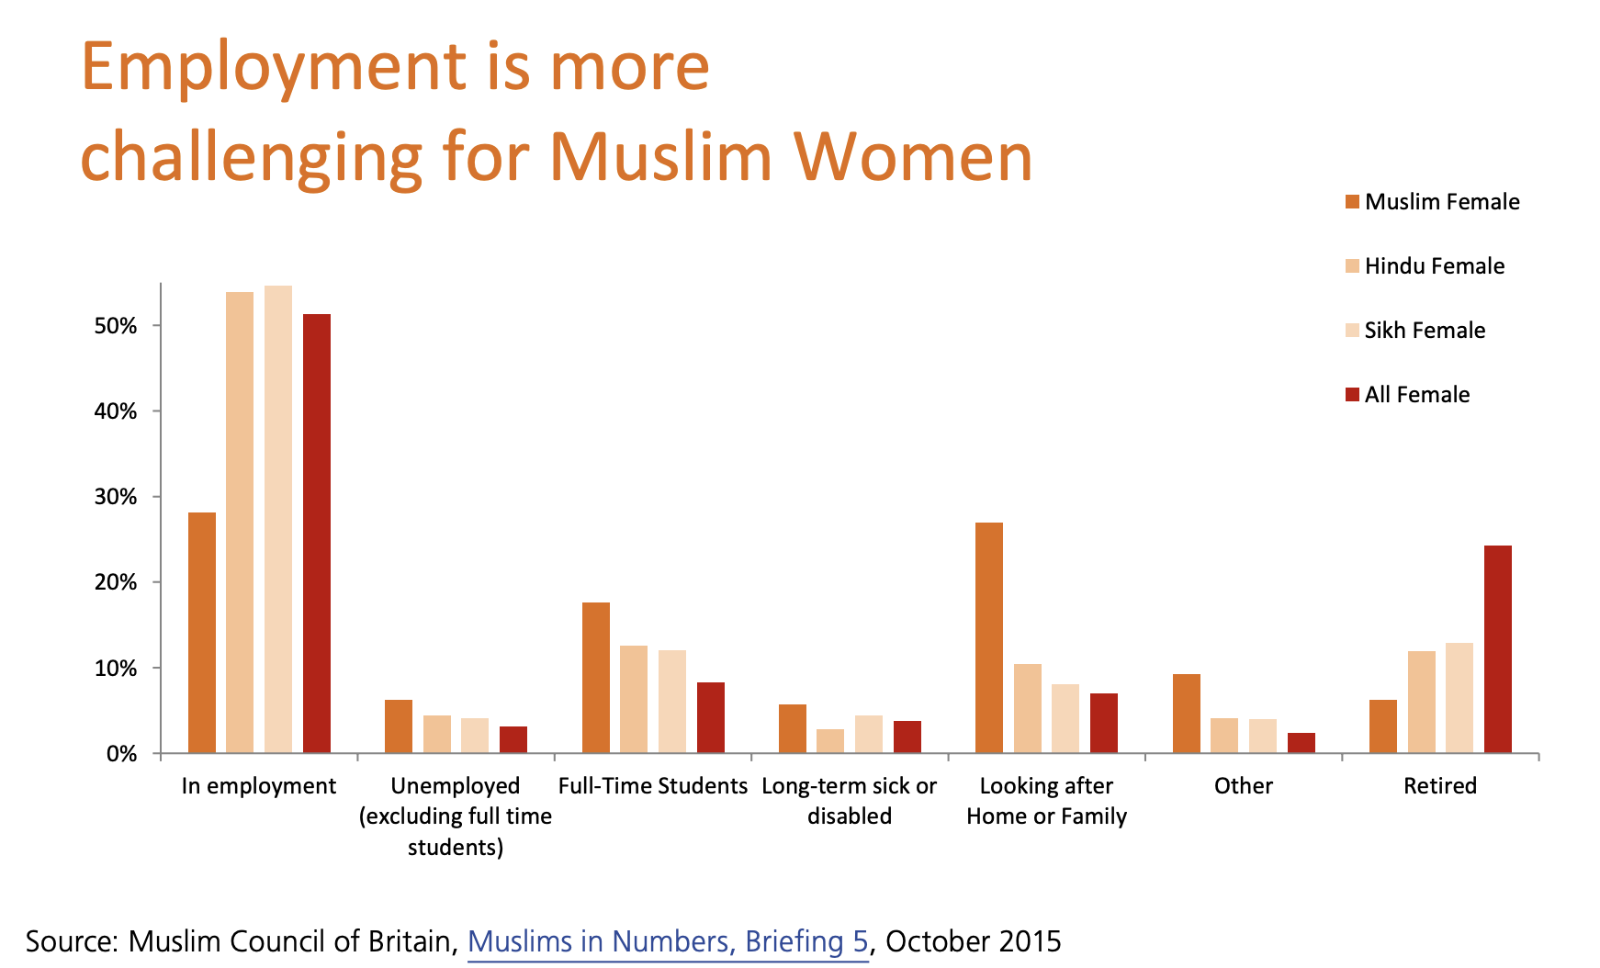
We see the same impact of lower female participation:
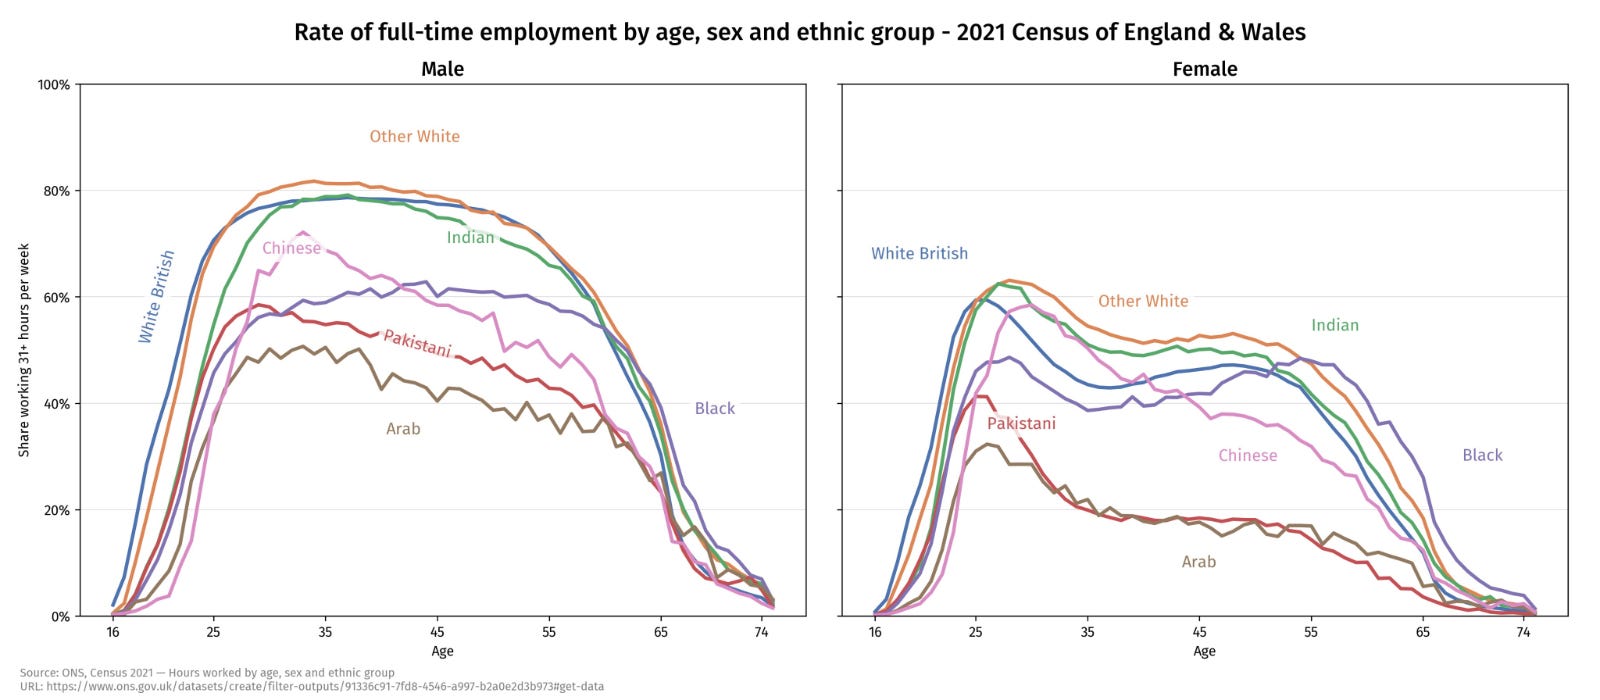
And this data shows this is not an effect of age. In the UK, Arabs and Pakistanis are substantially less employed than any other ethnicity, and the gap for women is astonishing.
Germany
Germany is interesting because the data is slightly different. We again see female Muslims with a very low employment rate. But men are slightly more likely to work than immigrants of other nationalities.
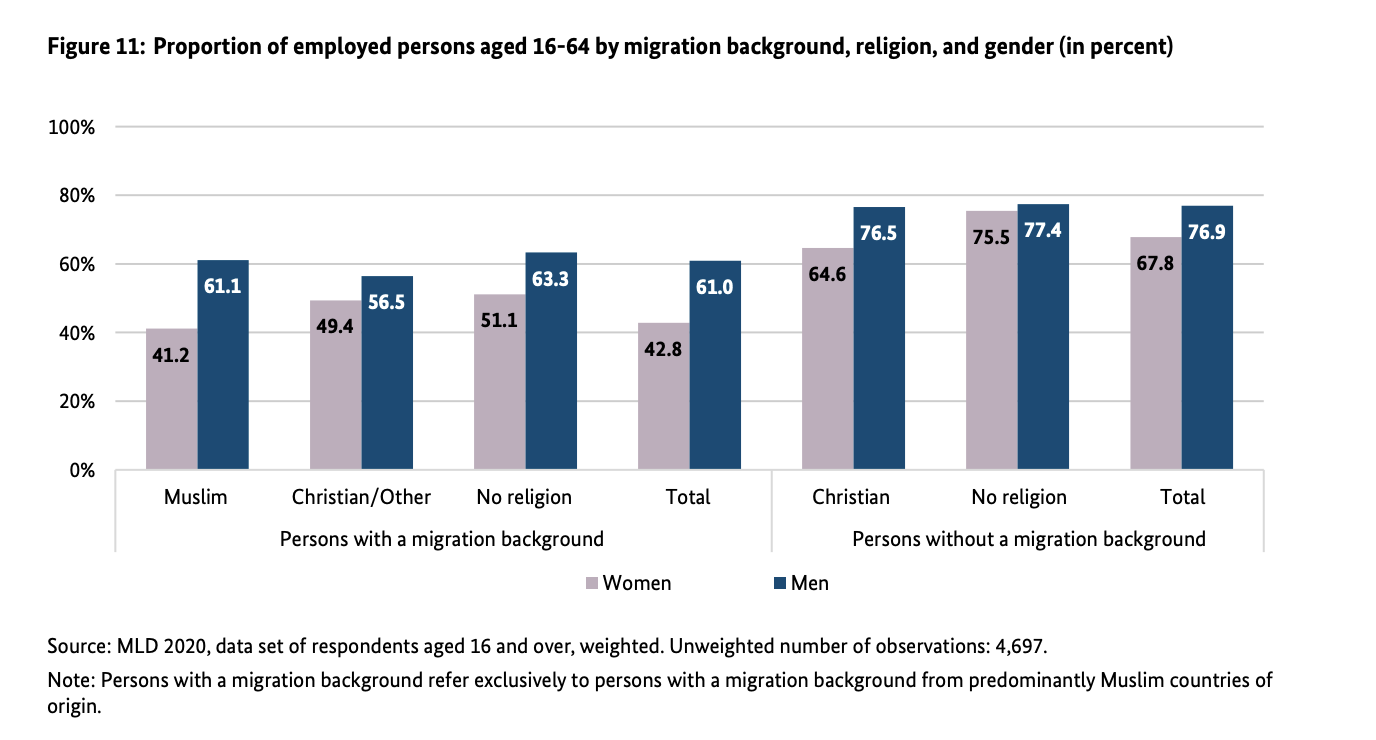
On balance, it looks like the two big contributors to lower work participation rate are immigration and, within that, Islam.
France
In France, the unemployment rate of African immigrants is more than twice that of locals, and it gets worse in the 2nd generation.
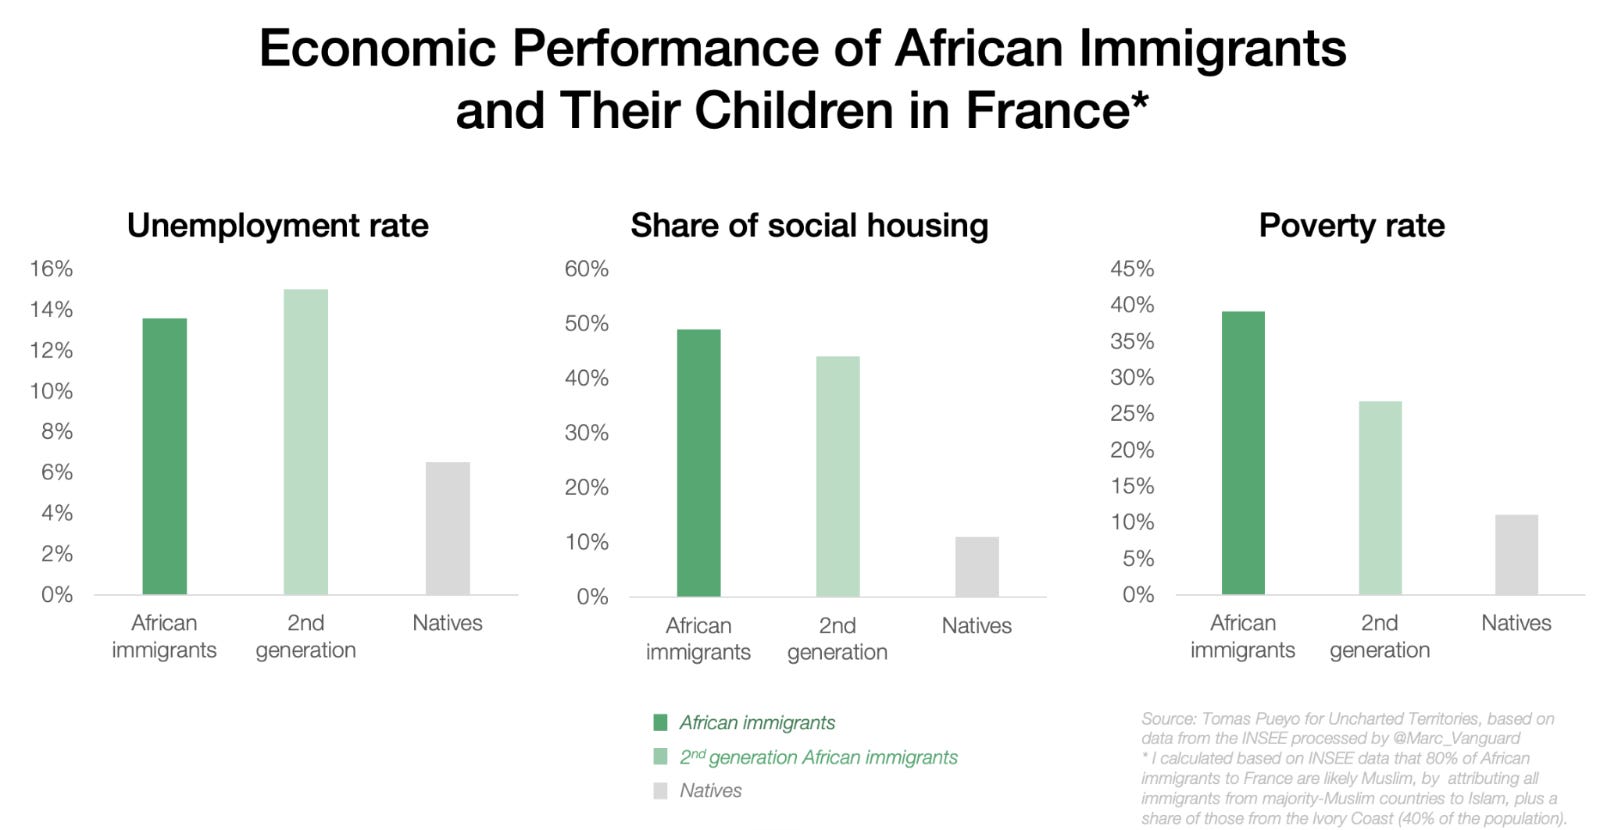
The shares of social housing (so, welfare) remain extremely high for the children of immigrants, and poverty rates remain quite high, too.
US
In the US, Muslim immigrants are more educated than the average American. However, they tend to be somewhat underemployed compared to Americans. The difference is not massive though.
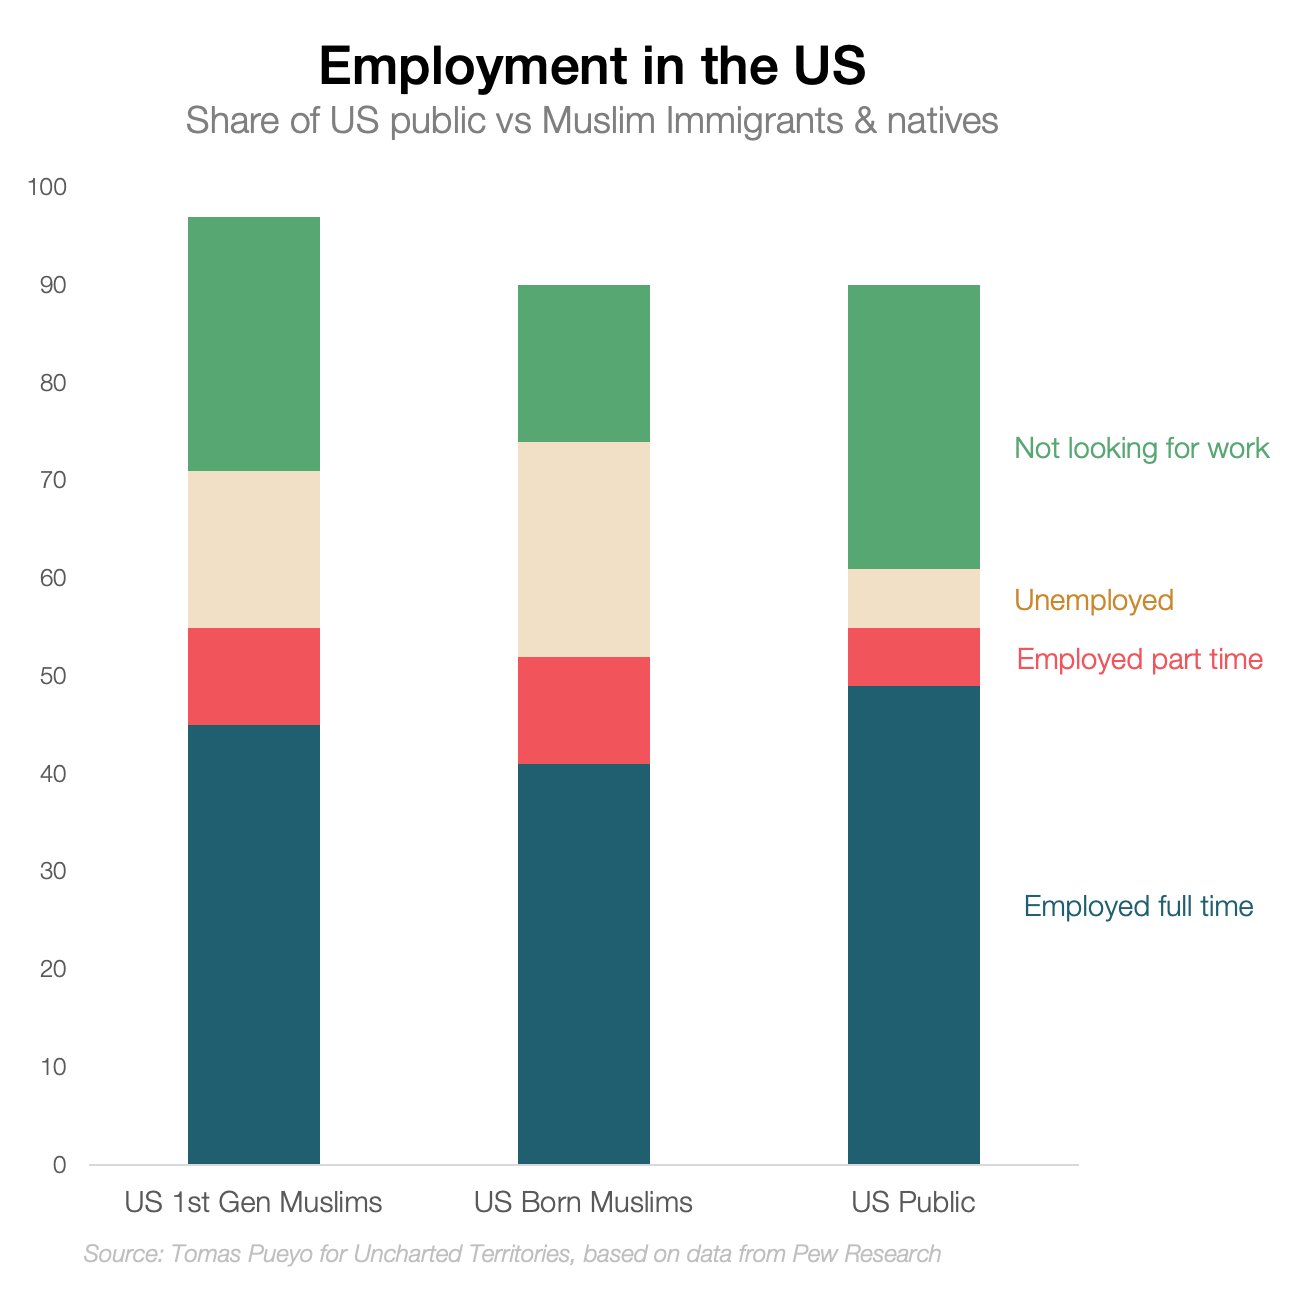
OK so what we’re seeing for Muslim immigrants is that those in Europe tend to have lower education than natives, and they also work less. About 50-70% of the men of working age work, and the number for women is usually about half of that. For the US, I don’t have more granular data, but it doesn’t look like these hold.5
Now, let’s look at state contributions: net costs vs benefits in terms of taxes contributed vs spent.
Fiscal Cost-Benefit
Denmark
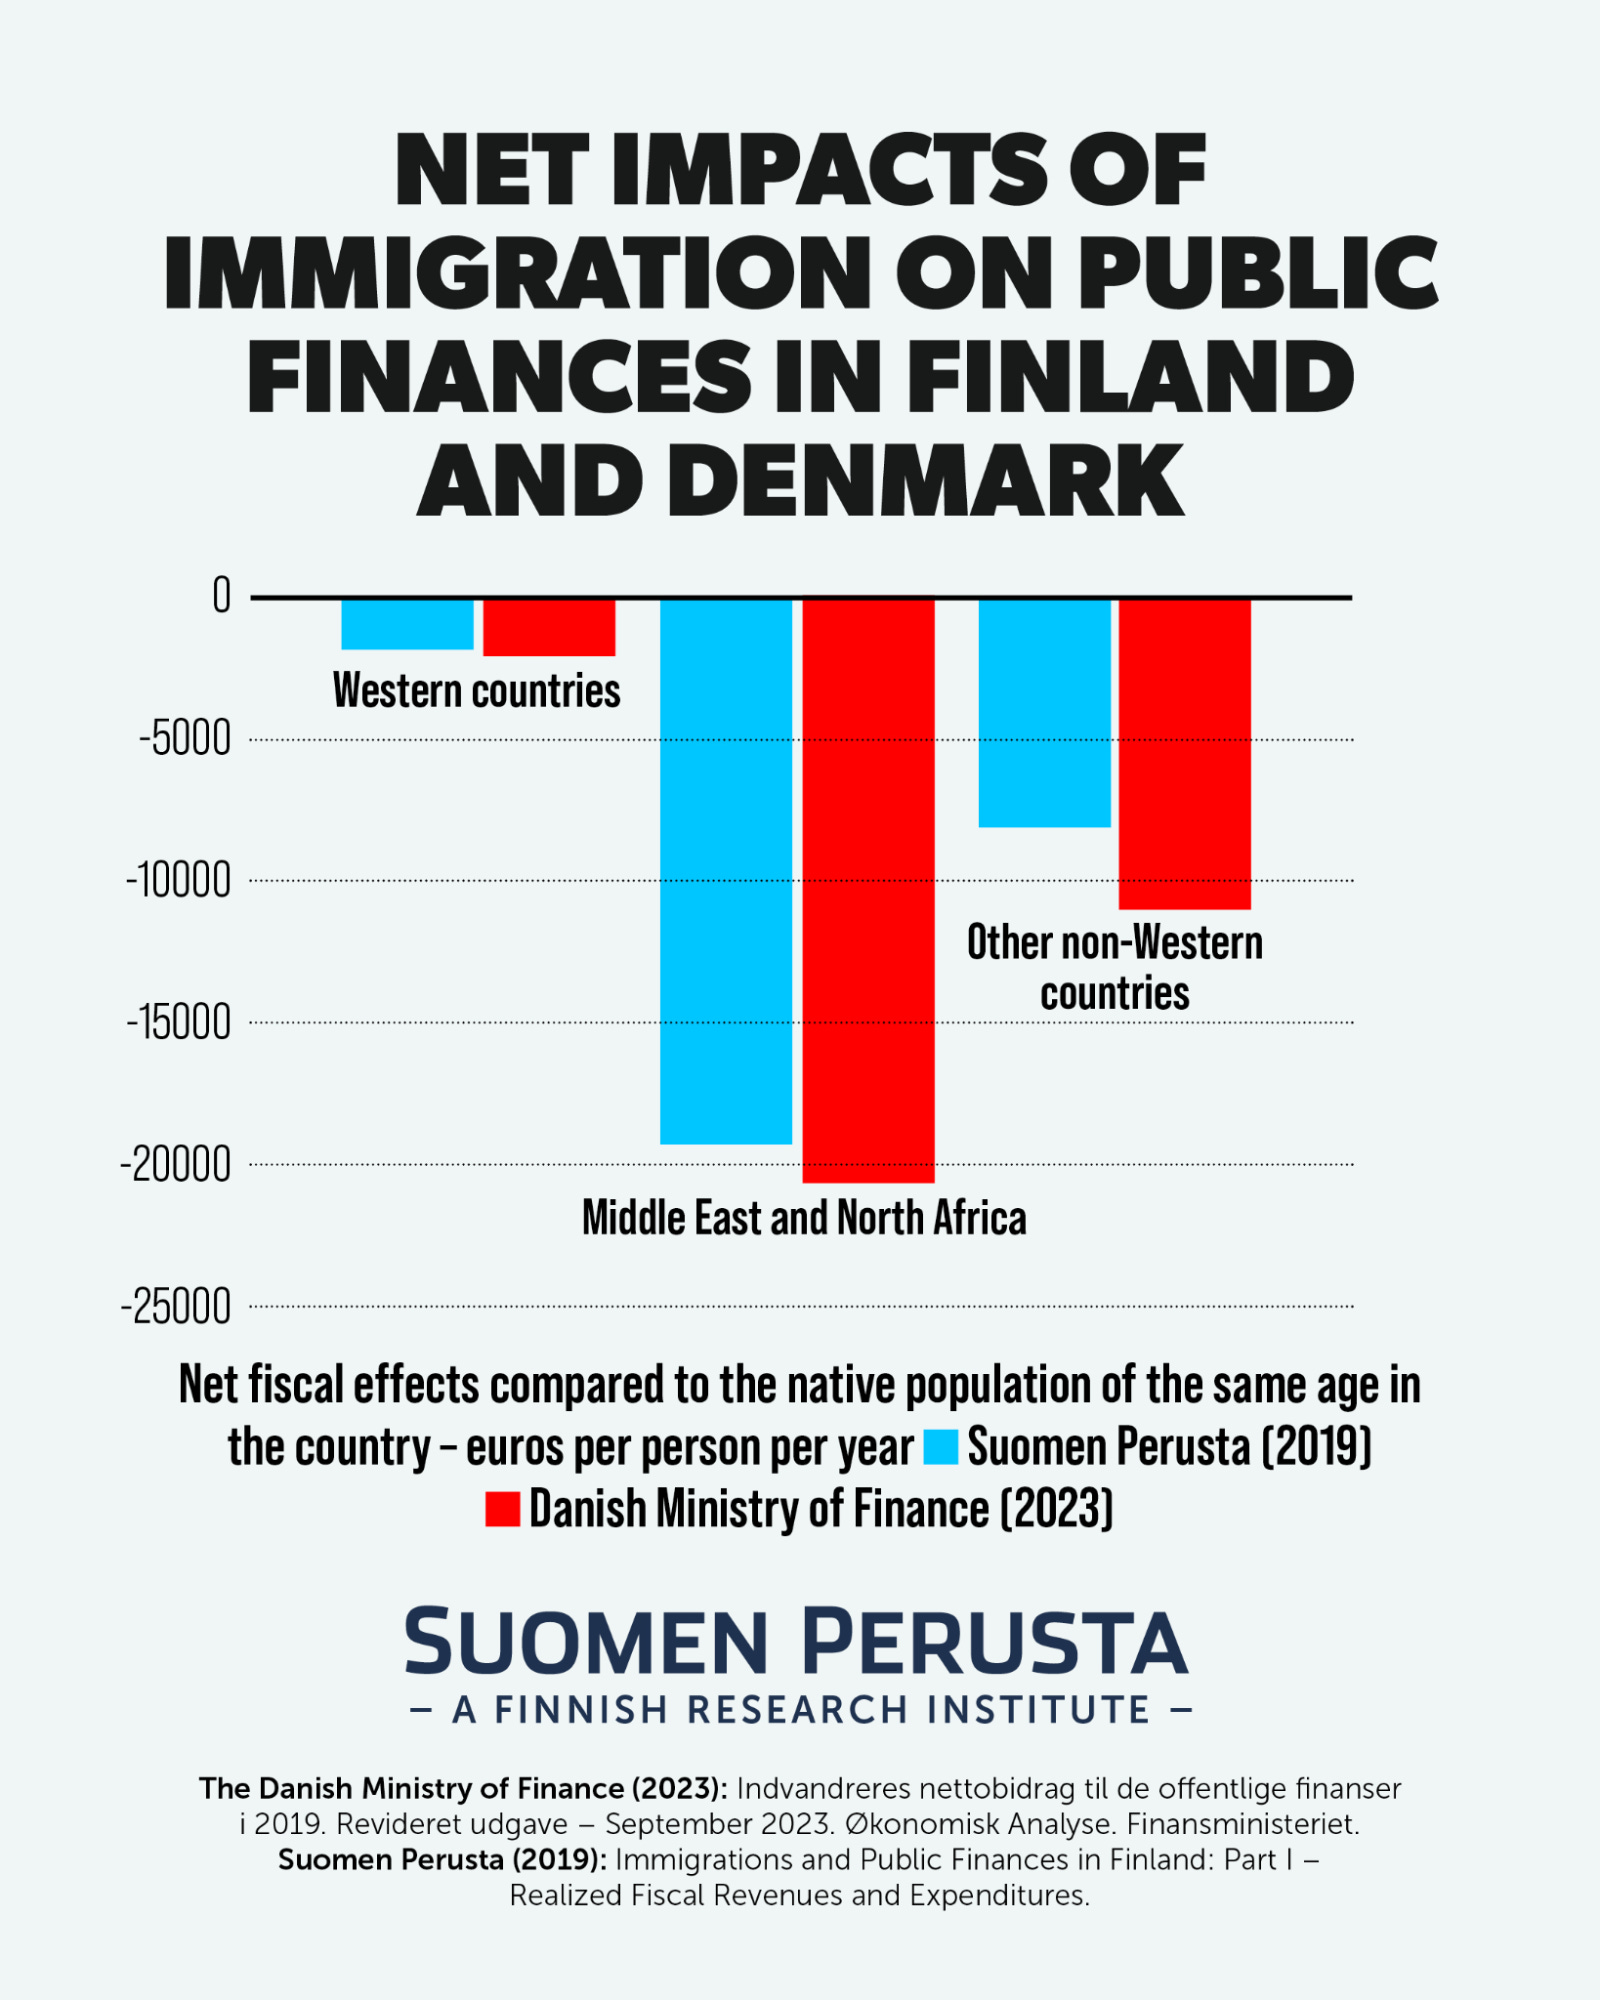
Denmark has some of the best data on this topic, so let’s look at it. I shared this before:
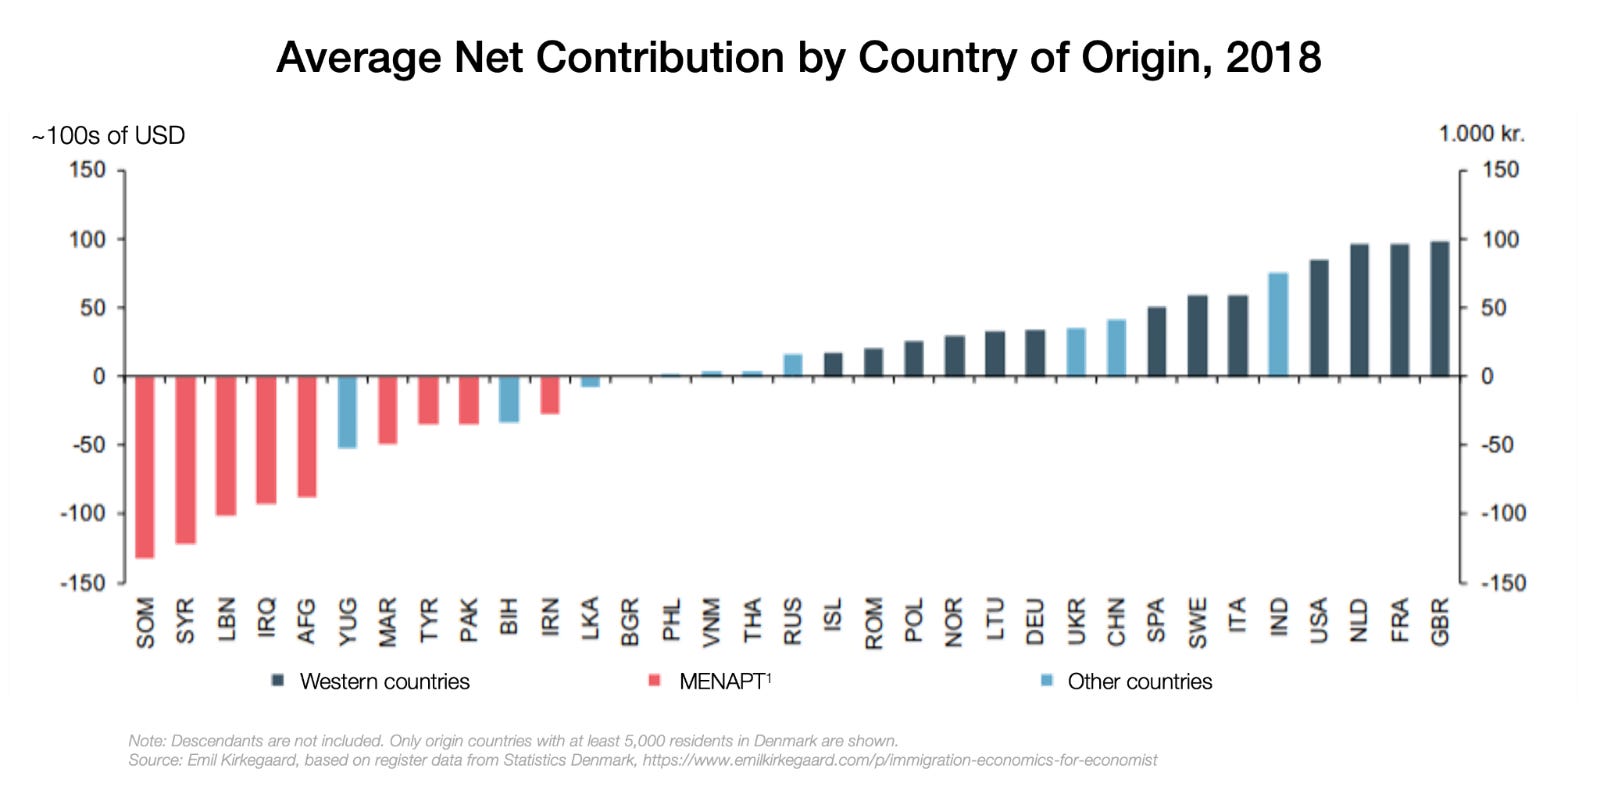
Because of this, every year Denmark spends 1.3% of its GDP in supporting MENAPT immigrants—about half the public budget spent on education. This is just to support these immigrants fiscally. This graph from The Economist shows the breakdown per age, compared to other types of Danish people:
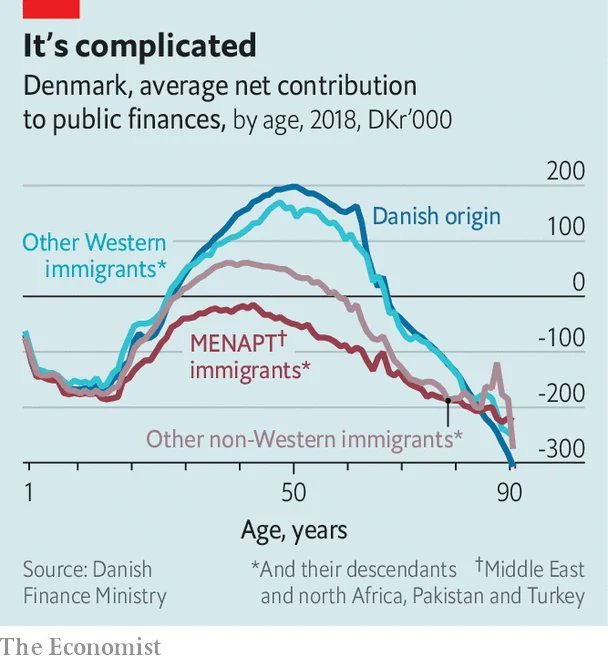
At no age do MENAPT immigrants contribute positively to the state. If you break that down per country of origin:
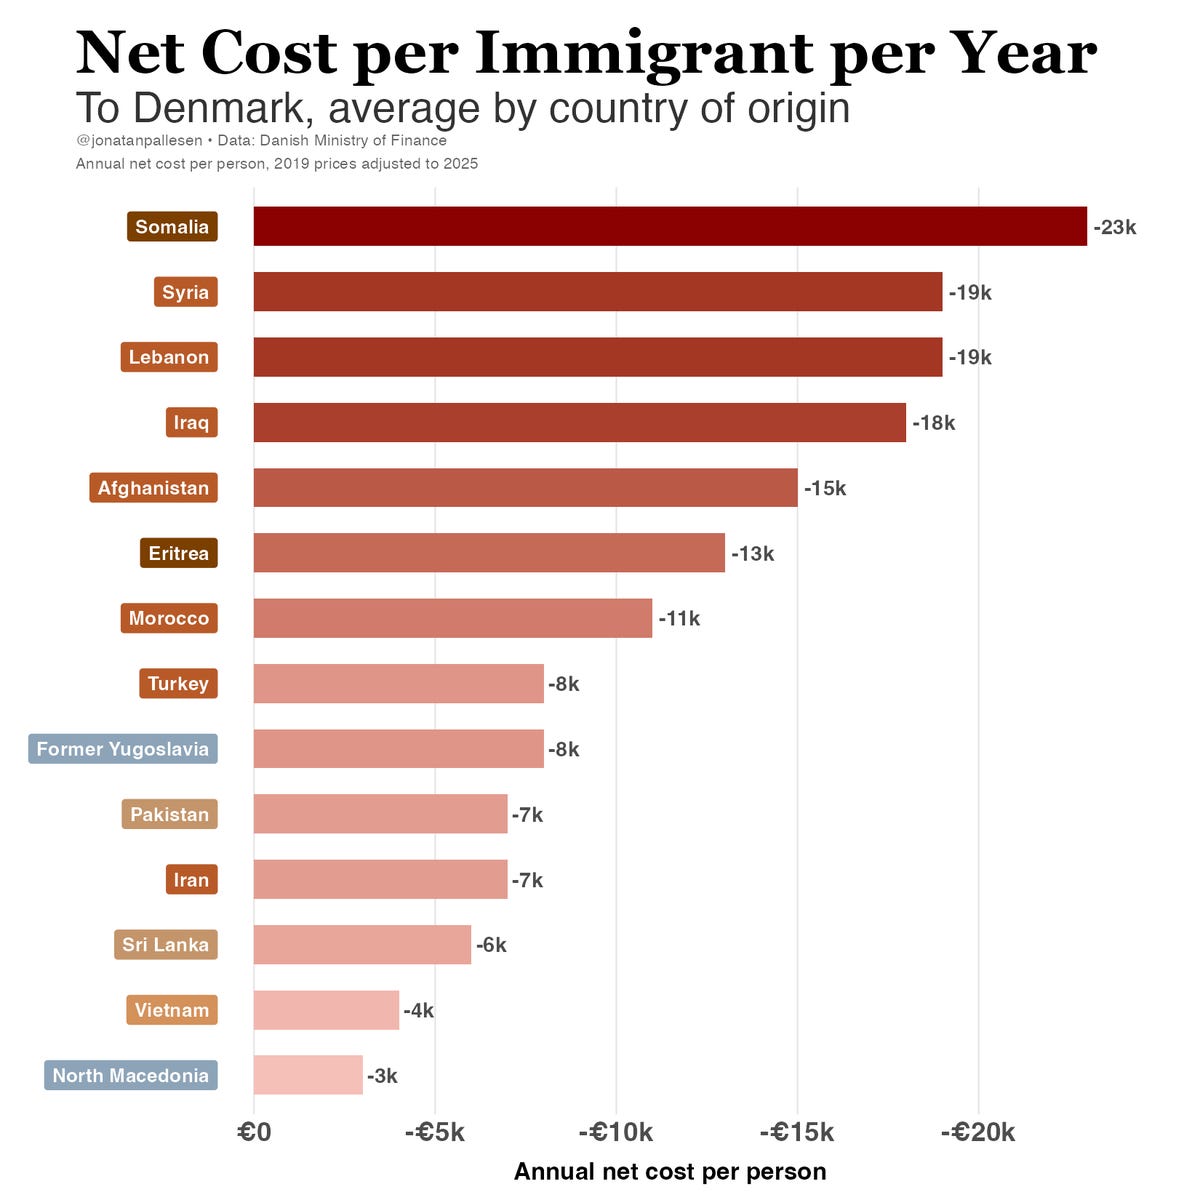
MENAPT are not the only immigrants to cost the state, but they cost the most. Every Somalian6 costs $27k per year!
Netherlands
This is the most massive study I’ve seen for any country on earth on the fiscal impact of immigrants. In it, the Netherlands shows fiscal contribution per country of origin (like in Denmark), but over their lifetime instead of per year, and for 1st and 2nd generation immigrants. Here it is, shown on a map of the world:
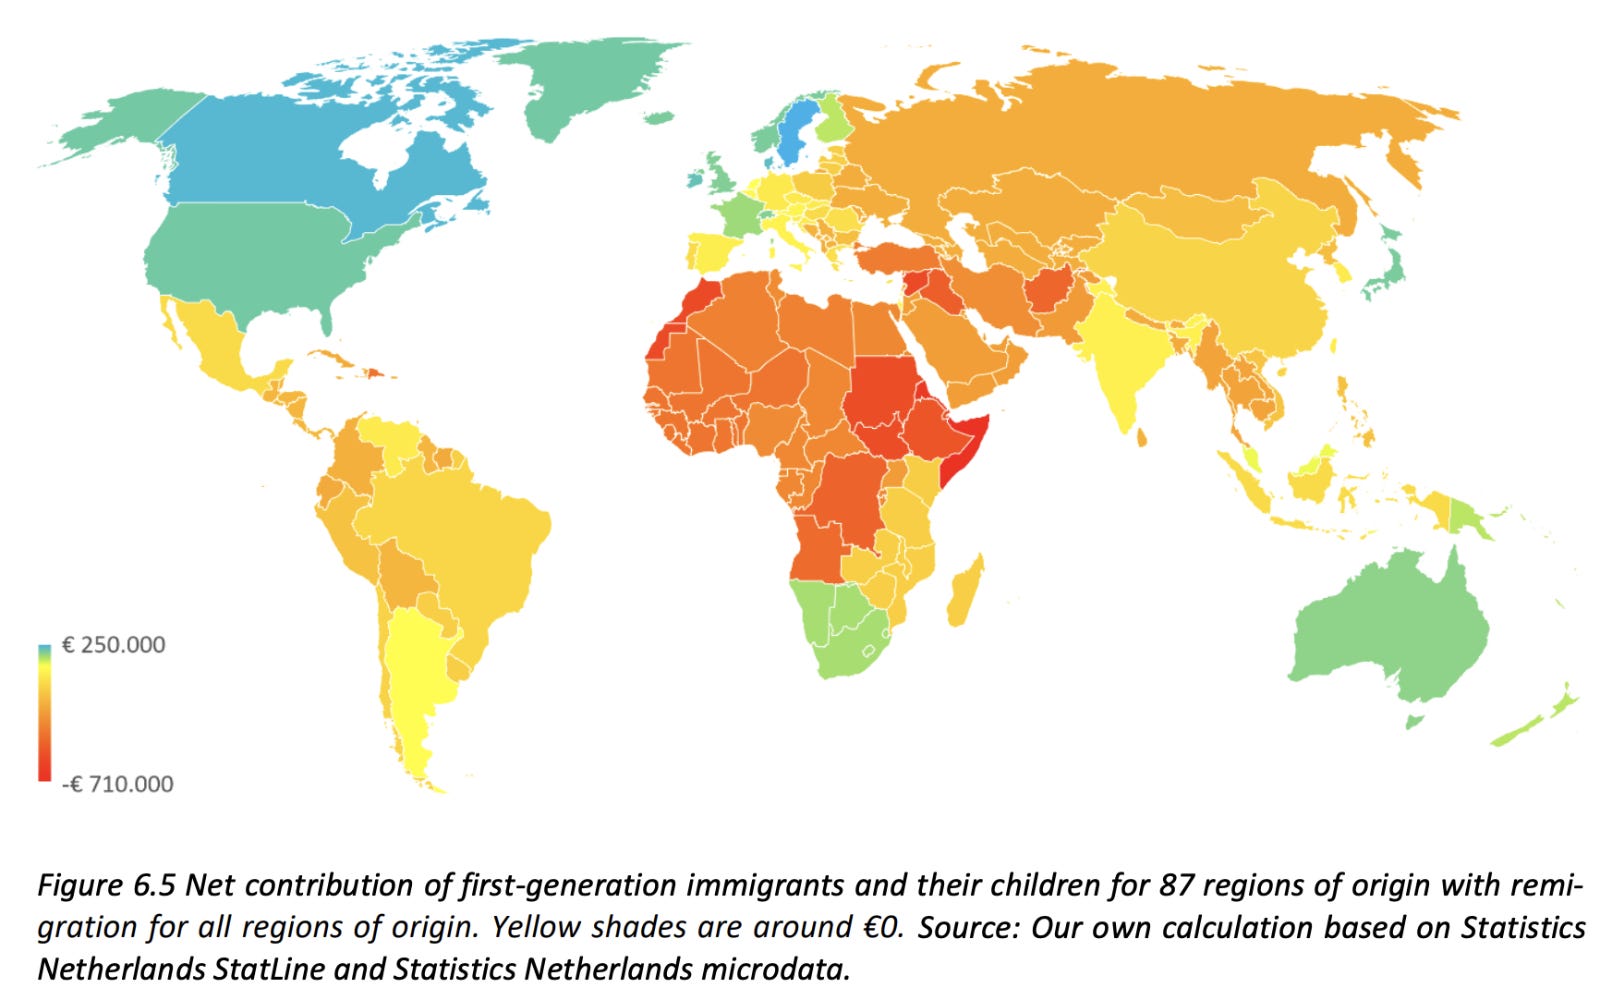
And here’s a detail per country/small region:
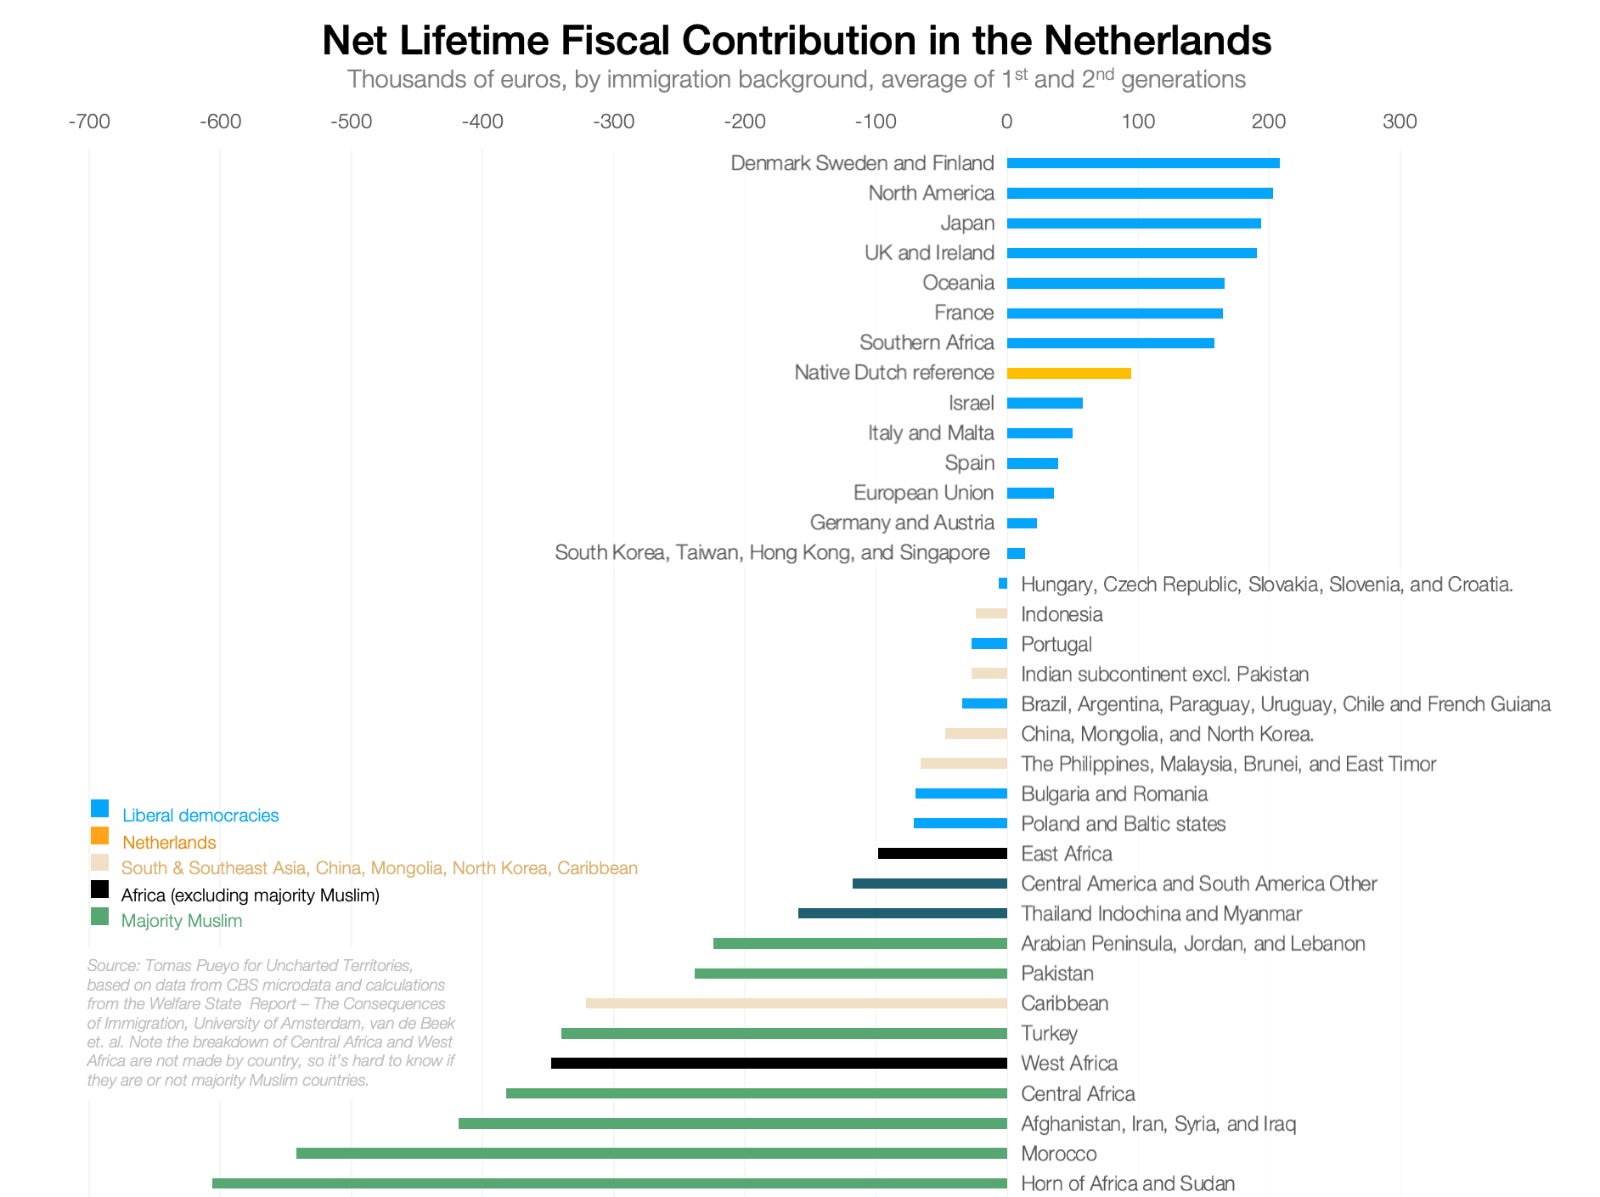
An average native-born Dutch family pays five thousand euros in taxes per year that end up being spent on immigrants.
A surprising fact: For the 2nd generation of immigrants, only those of Danish, Swedish, Finnish, and Chinese background were net positive. Every other origin drained state coffers rather than contributing to them.
Why? Here’s the share of benefit recipients vs the likelihood of them leaving within 10 years of arriving:
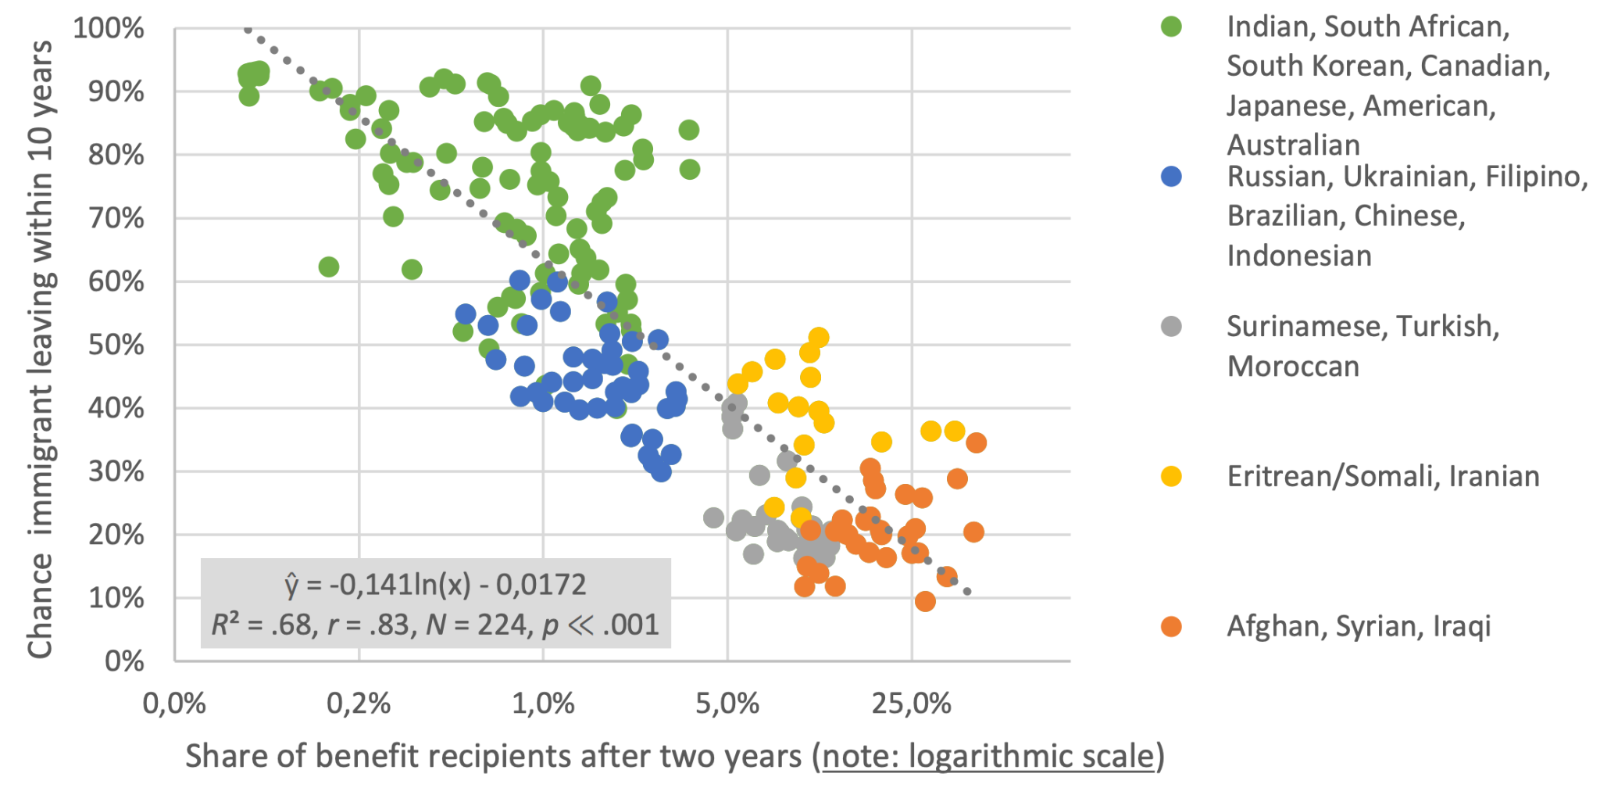
The most likely to ask for welfare support are the least likely to leave.
Finland
This is for Finland:
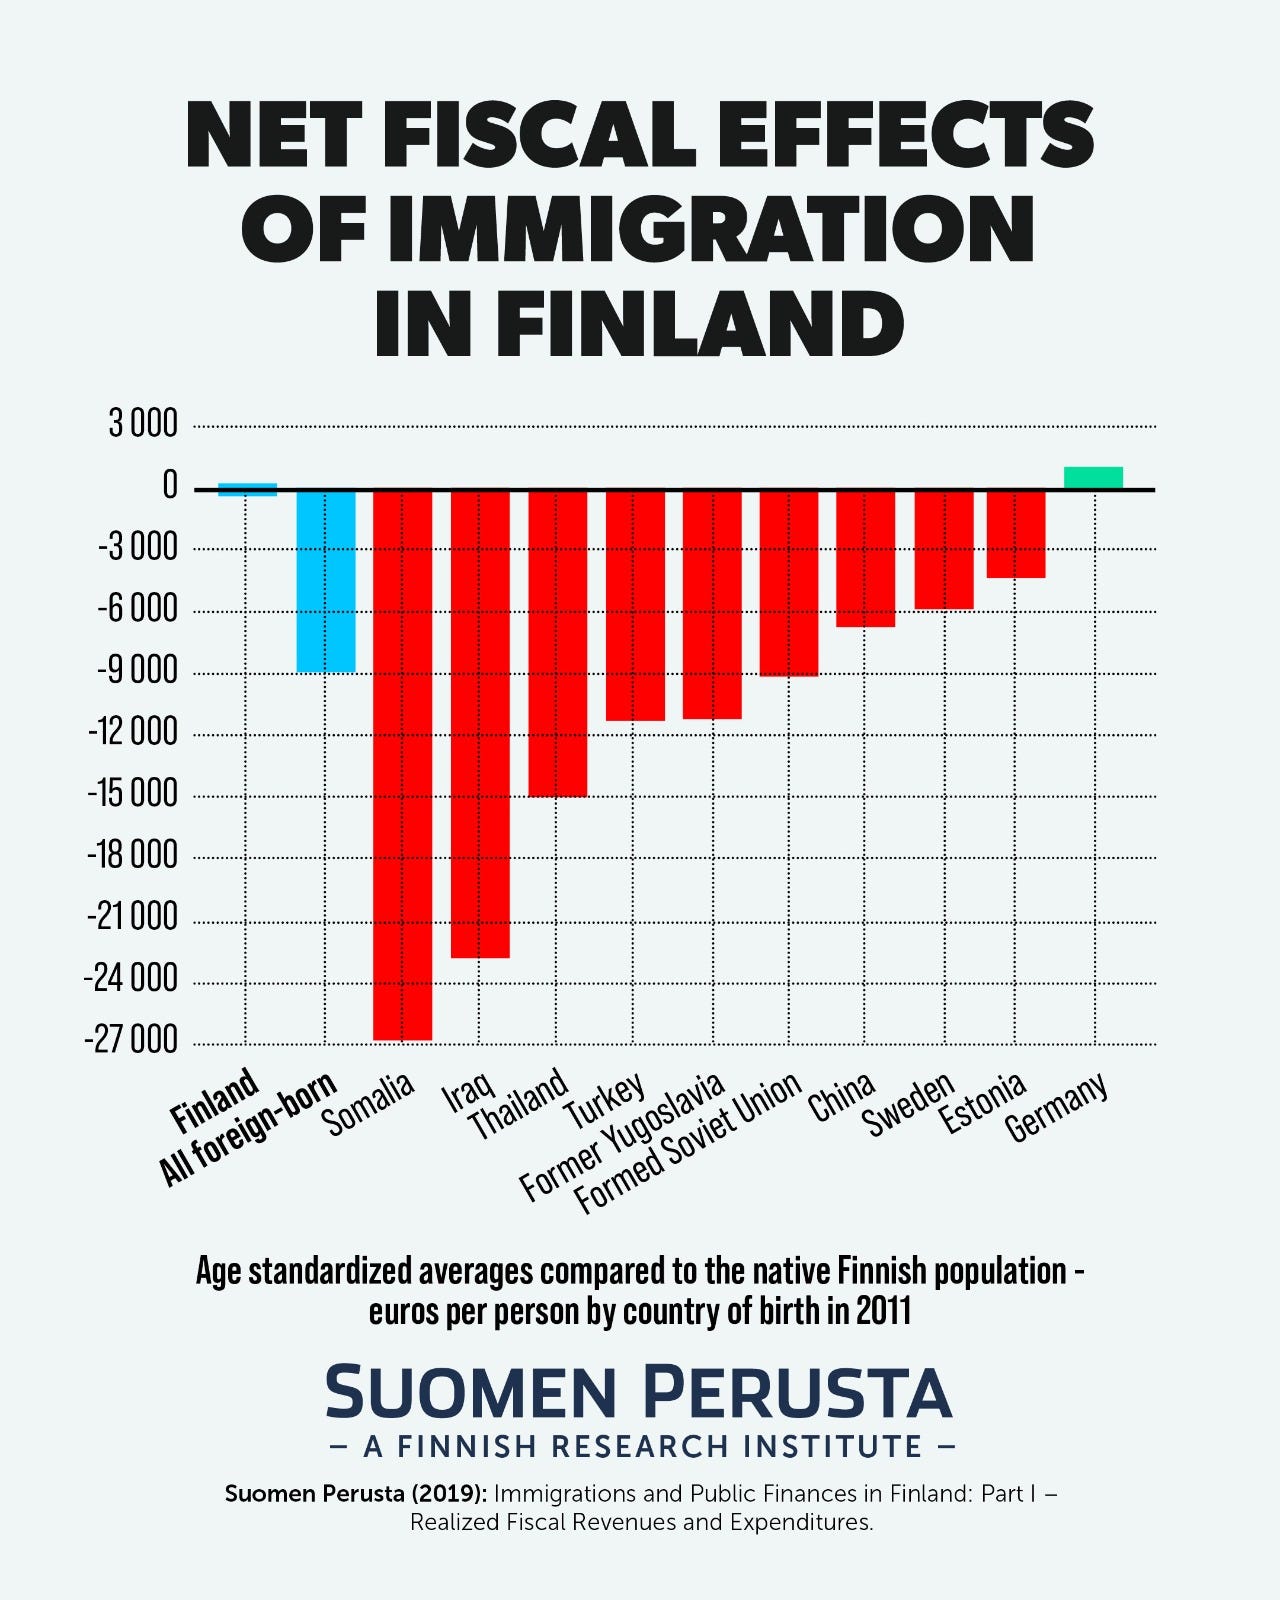
Here’s a breakdown per country:
Portugal
The data that we have for Denmark, Finland, and the Netherlands isn’t as readily available for other countries. Portugal has data per person per country, but only tax contributions, not welfare costs.
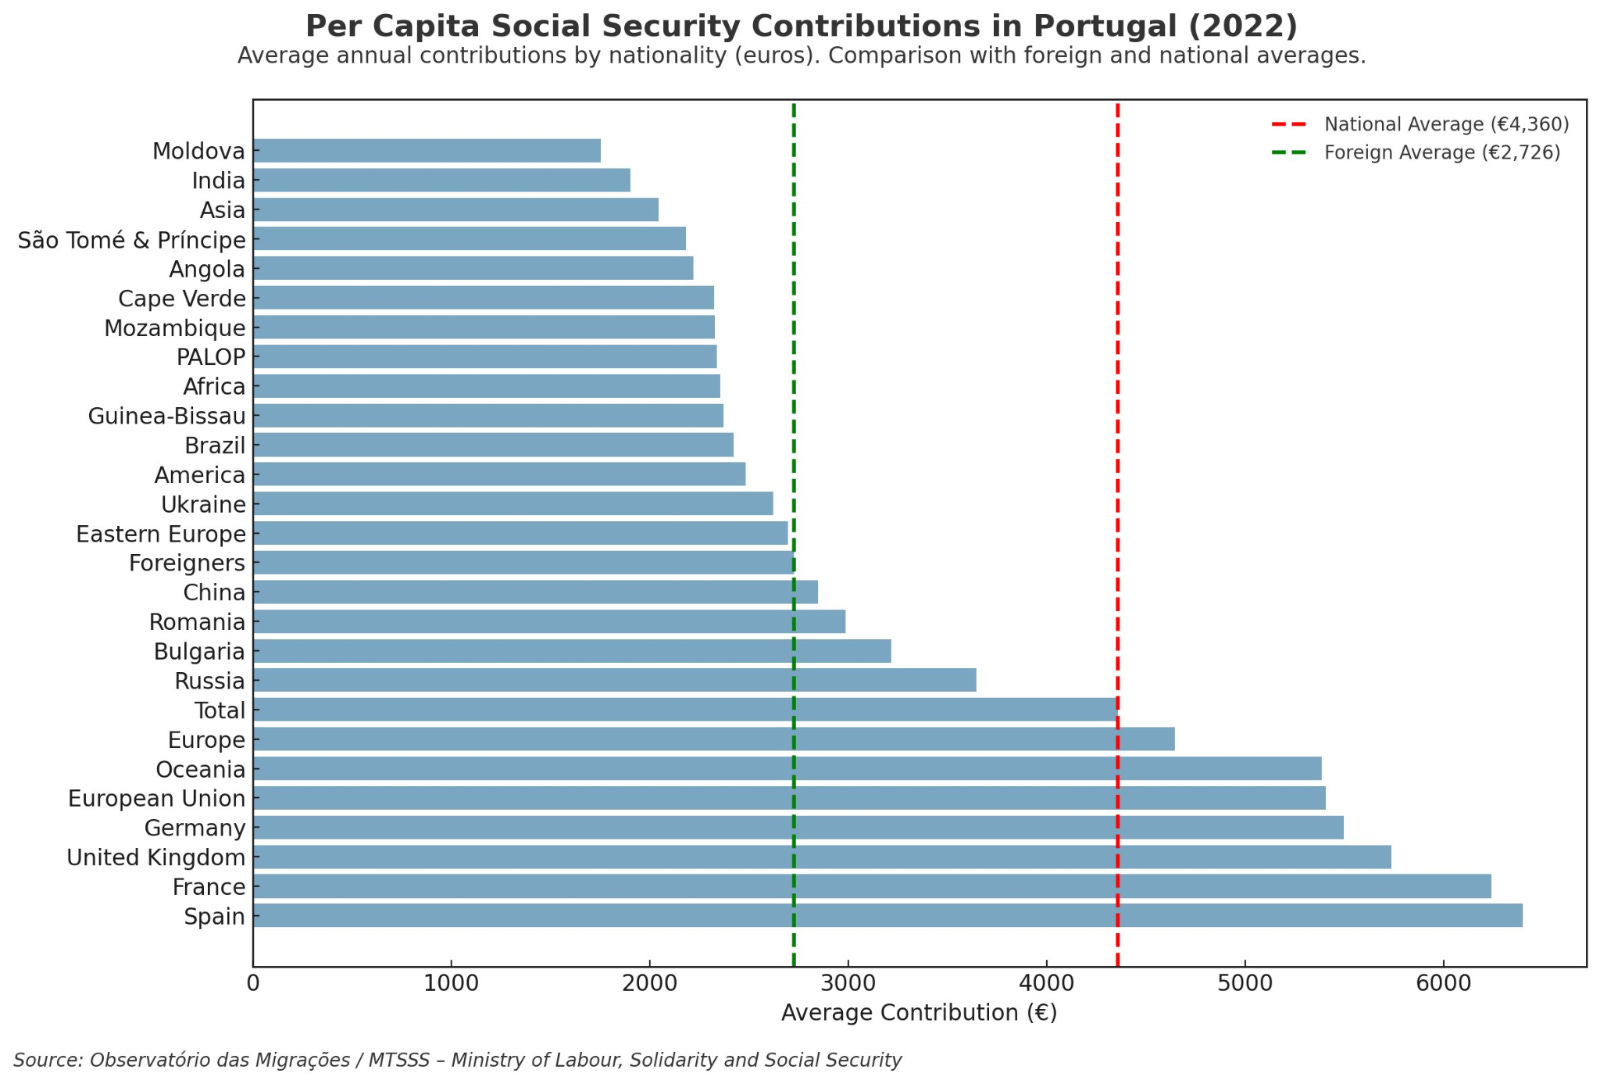
Here, we can’t see Muslims, because only 0.4% of the Portuguese population is Muslim. They don’t tend to immigrate to Portugal.
So if we summarize the economic side, Muslim immigrants to Europe, compared to locals, tend to:
Work less
Have lower levels of skill
Consume much more welfare
Takeaways: What Should the EU Do?
The takeaway so far is that in Europe, immigrants:
Work less than the average native.
After locals, the next most productive are EU citizens. The least productive tend to be Muslims
This is in a big part because of women not working, but not entirely.
Immigrants are nearly always fiscally expensive.
Muslim immigrants cost in general more money to the state.
This cost isn’t erased at the 2nd generation.
Immigrants commit substantially more crime than any other group.
Across destination countries, Muslims commit the most crime.
Islamists are behind most of the terrorism.
Immigration reduces local trust and social capital, probably more due to segregation than other factors, but also because of cultural transmission.
Again, it seems like this is more true of Muslim immigrants than others.
Does that mean that massive waves of deportations should take place in Europe? No:
Europe needs immigrants.
Many countries are quite good at taking in immigrants.
Many immigrants take several generations to converge to local performance.
The numbers above are not complete. They’re missing some other factors.
A large part of the problem is caused not by the immigrants, but by European legislation.
Not all immigrants are the same. They should be treated differently.
These are the things we’re going to look at in the next article.
The exceptions are Spain and Portugal, which get more from Latin America, and the countries that received a lot of Ukrainians, like Poland. Data from Eurostat.
One or more, as repeats were not counted.
In the case of Albania, it’s a plurality, not a majority. Spain appears to have a serious problem with Albanians. They account for only 0.1% of foreigners, but 2.5% of criminals in prison.
In the Netherlands, the biggest sources of immigrants are Indonesians and Surinamese. I don’t know the baseline crime rate of Surinamese, but for Indonesians it’s very low in Germany, so I assess it’s very low in the Netherlands too. The next two groups are Turks and Moroccans. Given their track record in other countries, it’s reasonable to estimate they have a high crime rate in the Netherlands too.
Immigrant Muslims have more education than the average American, and they work just a bit less, which suggests both men and women Muslim immigrants work more than in Europe.
Usually included in the definition, even though it belongs to neither North Africa nor the Middle East. But it’s close by and also majority Muslim.
Seems like an extremely poor post, which is a shame.
At a minimum you should have referenced the US to compare - for the past hundred+ years, immigrants both legal and illegal have been UNDERrepresented in incarceration statistics
https://ranabr.people.stanford.edu/sites/g/files/sbiybj26066/files/media/file/immigration_incarceration_jan2024.pdf
The US comparison for welfare usage - immigrants use far less welfare than native born https://www.cato.org/blog/immigrants-use-less-welfare-native-born-americans
Back to Europe specifically, or more generally, a review of immigration and crime in the OECD. https://pubs.aeaweb.org/doi/pdfplus/10.1257/jep.38.1.181 - No correlation of immigration and crime (where they use homicide as a proxy for crime overall)
I'll quote the paper
>The frequent overrepresentation of incarcerated immigrants relative to overall
population, depicted in Figure 3, might be due to two measurement issues quite
specific to immigration-crime statistics. One is that irregular aliens (that is, those
not officially registered by the appropriate process in that nation) would be counted
in the share of immigrants in the prison population, but not in the share of immigrants in the resident population. The other is the potential harsher treatment of
foreigners by the police and the judiciary system due to discrimination or unequal
access to legal services and noncustodial measures, such as bail or home-detention.
Alone, not enough to explain it all, as they say, but then add in the adjustments by age, education, income, etc and I think you're getting somewhere.
More importantly, you didn't discuss integration or potential biased enforcement of laws at all in your post. Which is a glaring oversight.
I haven't looked it up, but I'd assume the graph which plots "Muslim majority" countries as distinct from "liberal democracies" is from some anti immigration group, because otherwise that's some whacky categorization and should have been an immediate red flag for you
I believe you're too willing to accept "crime isn't about money" too - a small study where people are given a few hundred dollars is not something that people can plan their lives around nor, would I think, likely to stop a criminal from committing crimes. You're accepting something as evidence when it's barely telling us anything, let alone about why people commit crimes or end up living a life of crime
Here's a section of the above OECD paper
>A different policy experiment in Italy involves the online procedure used to
award work permits. Prospective employers of immigrant workers must send an
electronic application on given “Click Days,” starting at 8 AM, and such applications
are processed on a first come–first served basis until available quotas of permits are
exhausted. Exploiting discontinuities in “click time” to compare those just eligible
for work permits to those not eligible, Pinotti (2017) finds that those eligible to
work are significantly less likely to be arrested during the following year. The size
of the effect is very large and remarkably similar, in relative terms, to that estimated
by Mastrobuoni and Pinotti (2015)—a drop of more than 50 percent relative to the
baseline crime rate—in spite of the fact that the two papers focus on very different
populations; that is, former prison inmates and applicants for work permits.
As it turns out, when people want to but can't work, they have no other option than to steal or starve. The EU is full of countries that make it harder than necessary to work as an immigrant, or hell just make it hard to work in general.
And while I'm at it some more sources that you might like
Immigrants in Portugal net contributed to the state 5:1, or in other words, 5 euros paid per euro taken in benefits
https://joaonevesanalytics.substack.com/p/contributory-impact-of-migrants-in#:~:text=2024%3A%20Preliminary%20data%20show%20another,contributions%20in%202024%20rr.pt.
And another for Portugal, areas with more immigrants as a share of population have lower crime rates https://home-affairs.ec.europa.eu/news/portugal-municipalities-more-immigrants-see-less-crime-2024-10-17_en
Really just a very poor post on your part, where you seem to uncritically repost stuff you see floating around on twitter or whatever and don't look into any of the actual research or even give lip service to questioning the source or how reliable it is. If this is what I can expect from you I don't know why I should stay subbed
Why do you think Europe needs immigrants?
Given the numbers you outlined and the way it feels on the streets, I am beginning to think that maybe those calling to keep Muslim immigrants from war torn countries out, might have a point. Especially men of soldiering age.
This is about religious politics that go all the way back to crusades, isn't it?
Given the facts you presented it is hard not to question my liberal attitudes to others.